



Hi Everyone,
I am Hollywood Gadfly. On my Substack, I write deep-dive essays about our industry’s most challenging issues: class, identity, and much more. I strive to do so in a nuanced, data-driven way, while also providing clear, practical guidance.
I’ve been a huge fan of Ted’s work since the 2000s. Very few people are as dedicated as he is to making the industry better, and he produced my two favorite Todd Solondz movies (Happiness and Storytelling) to boot! I’m very grateful he’s allowing me to take over his Substack for this post.

Last week on this Substack, Raquelle David argued that Hollywood’s gatekeepers keep hiring people who look like themselves. To do so, she used data from 2015, and I’m not convinced.
I ran the numbers myself, and the data show that the middle of the industry has changed significantly since then, while the top has moved more slowly.
From what I can see, that gap is less about gatekeepers and more about how long it takes a diversified middle to advance to the top.
Part 1: Agents and Executives
The thesis of David’s essay is:
“I vehemently believe that representation has a representation problem.” She continues to say that “it goes without saying that reps tend to champion voices that feel familiar to them.”
David calls this an “affinity bias.” She goes on to call out agents and managers for building out rosters that are white and male. But the essay doesn’t provide any current roster data that would allow us to test that proposition.
Her piece relies on 2015 data from UCLA’s 2016 Hollywood Diversity Report, but today’s data shows meaningful progress.1
Nota Bene: I wasn’t able to construct a comparable current dataset on race, so what follows tests only the gender component of that claim. I am also not discussing her LGBTQ claims.2
The Agencies
I ran the current agency numbers on gender myself.3 First, let’s look at the partners.4
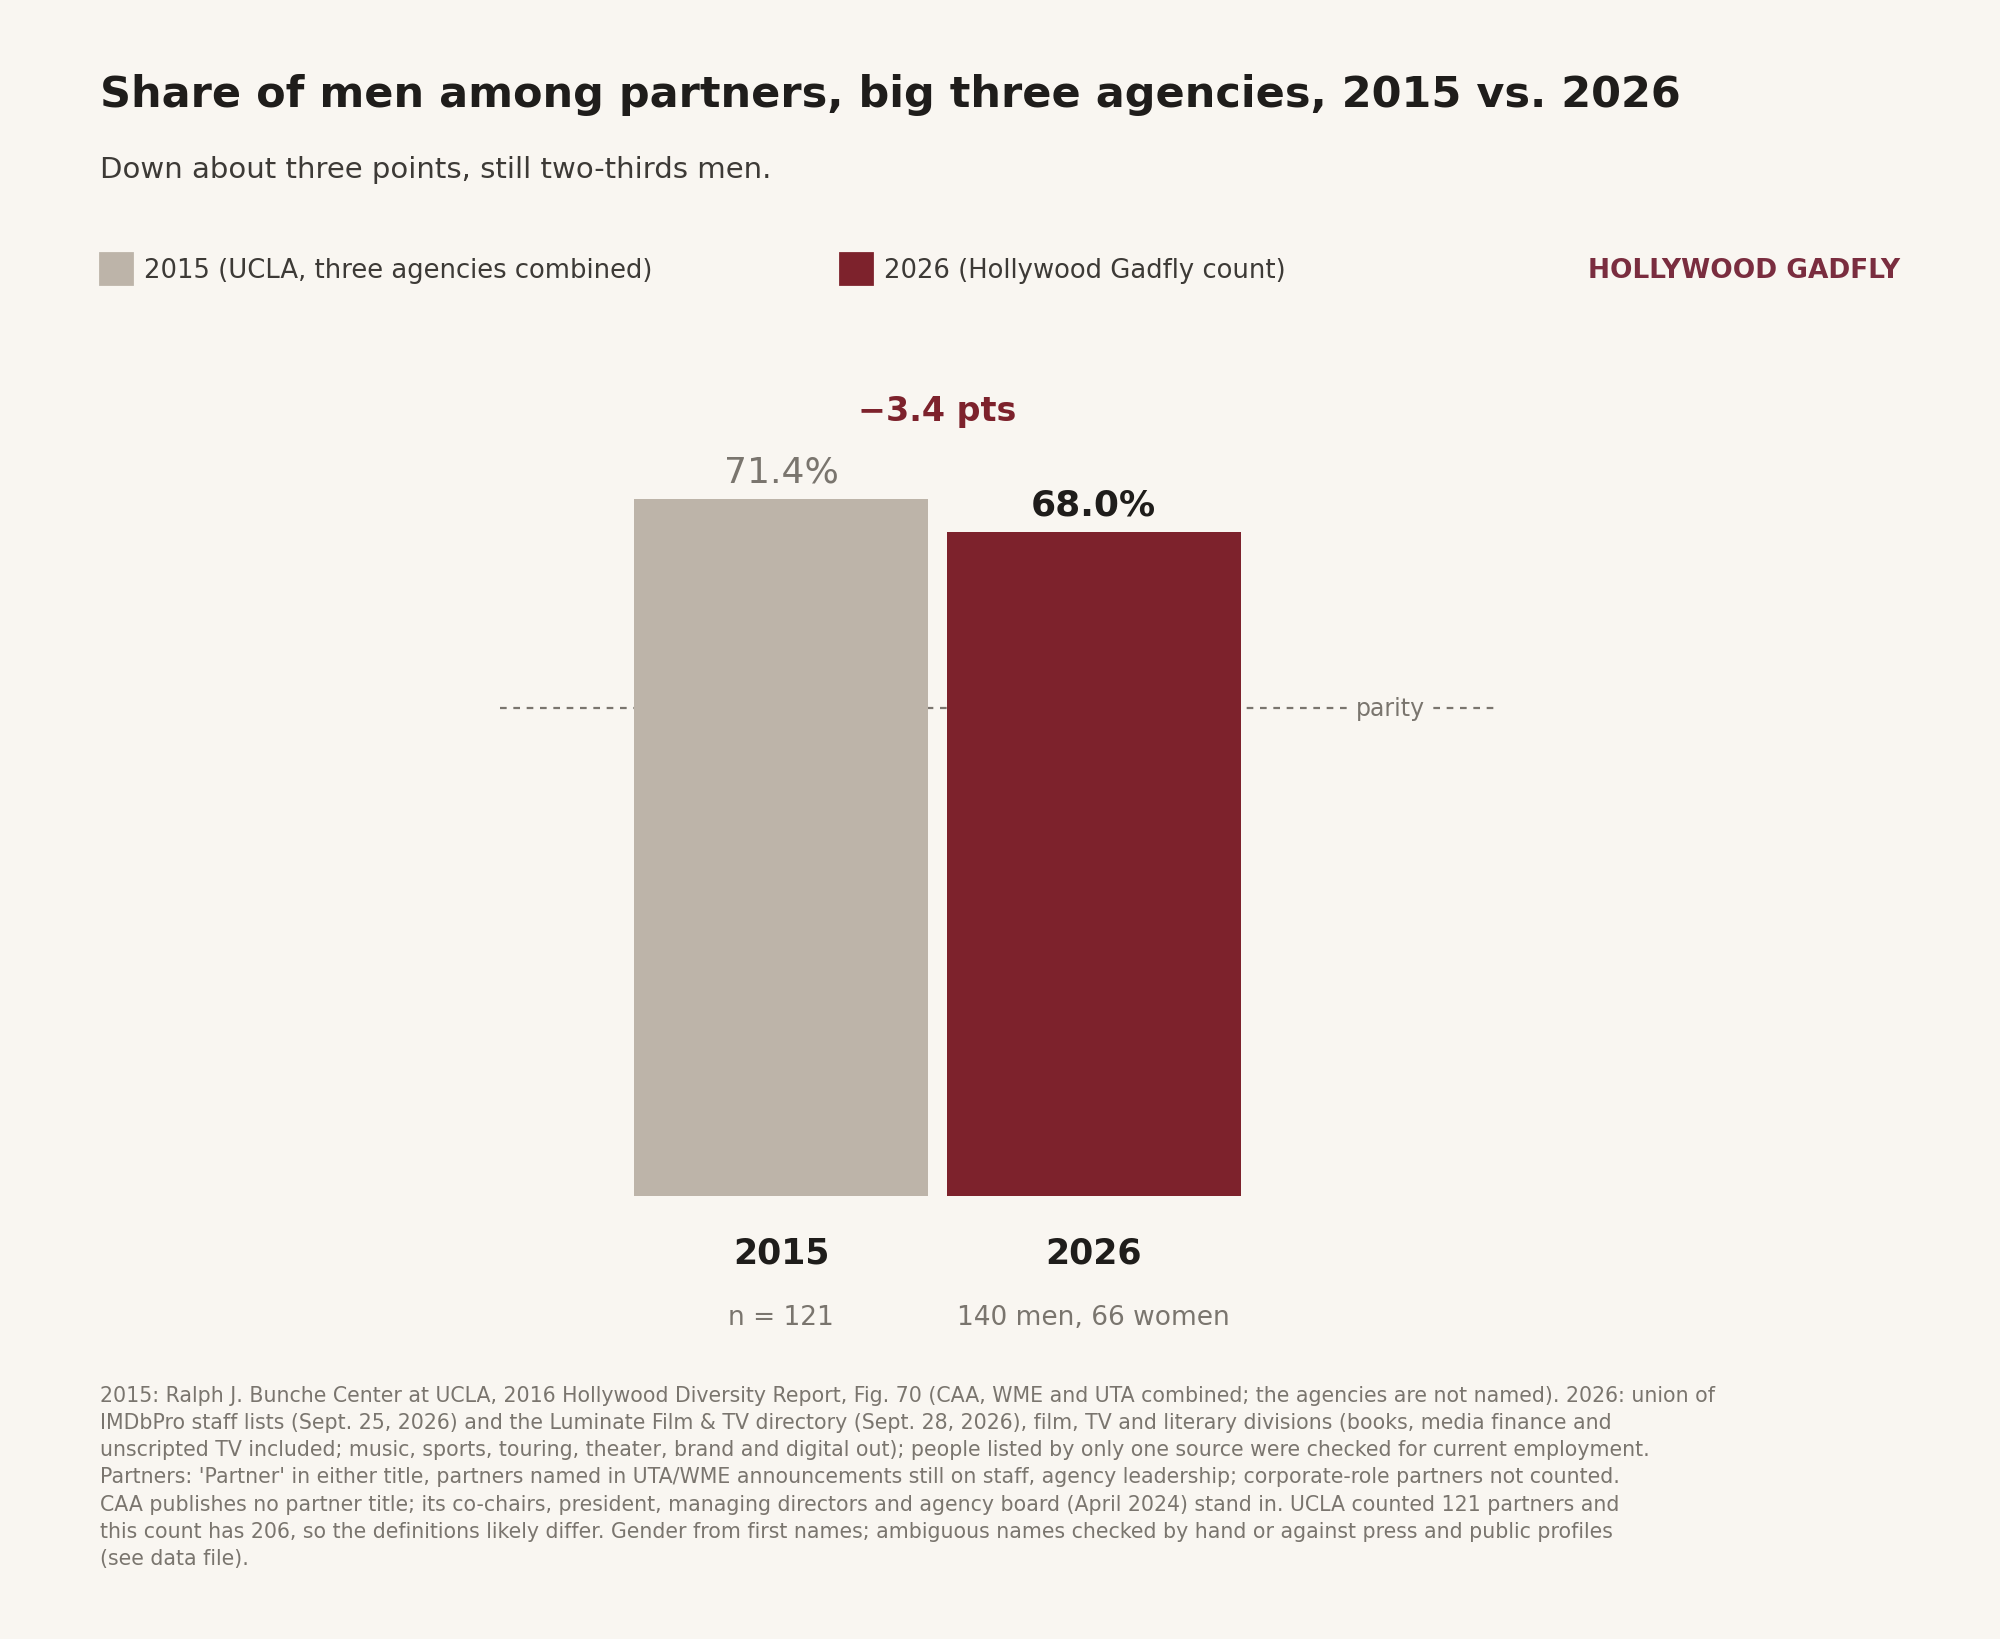
It’s moving pretty slowly, just 3.4 points. But if you look at the people being promoted to partner, it’s going in the right direction:
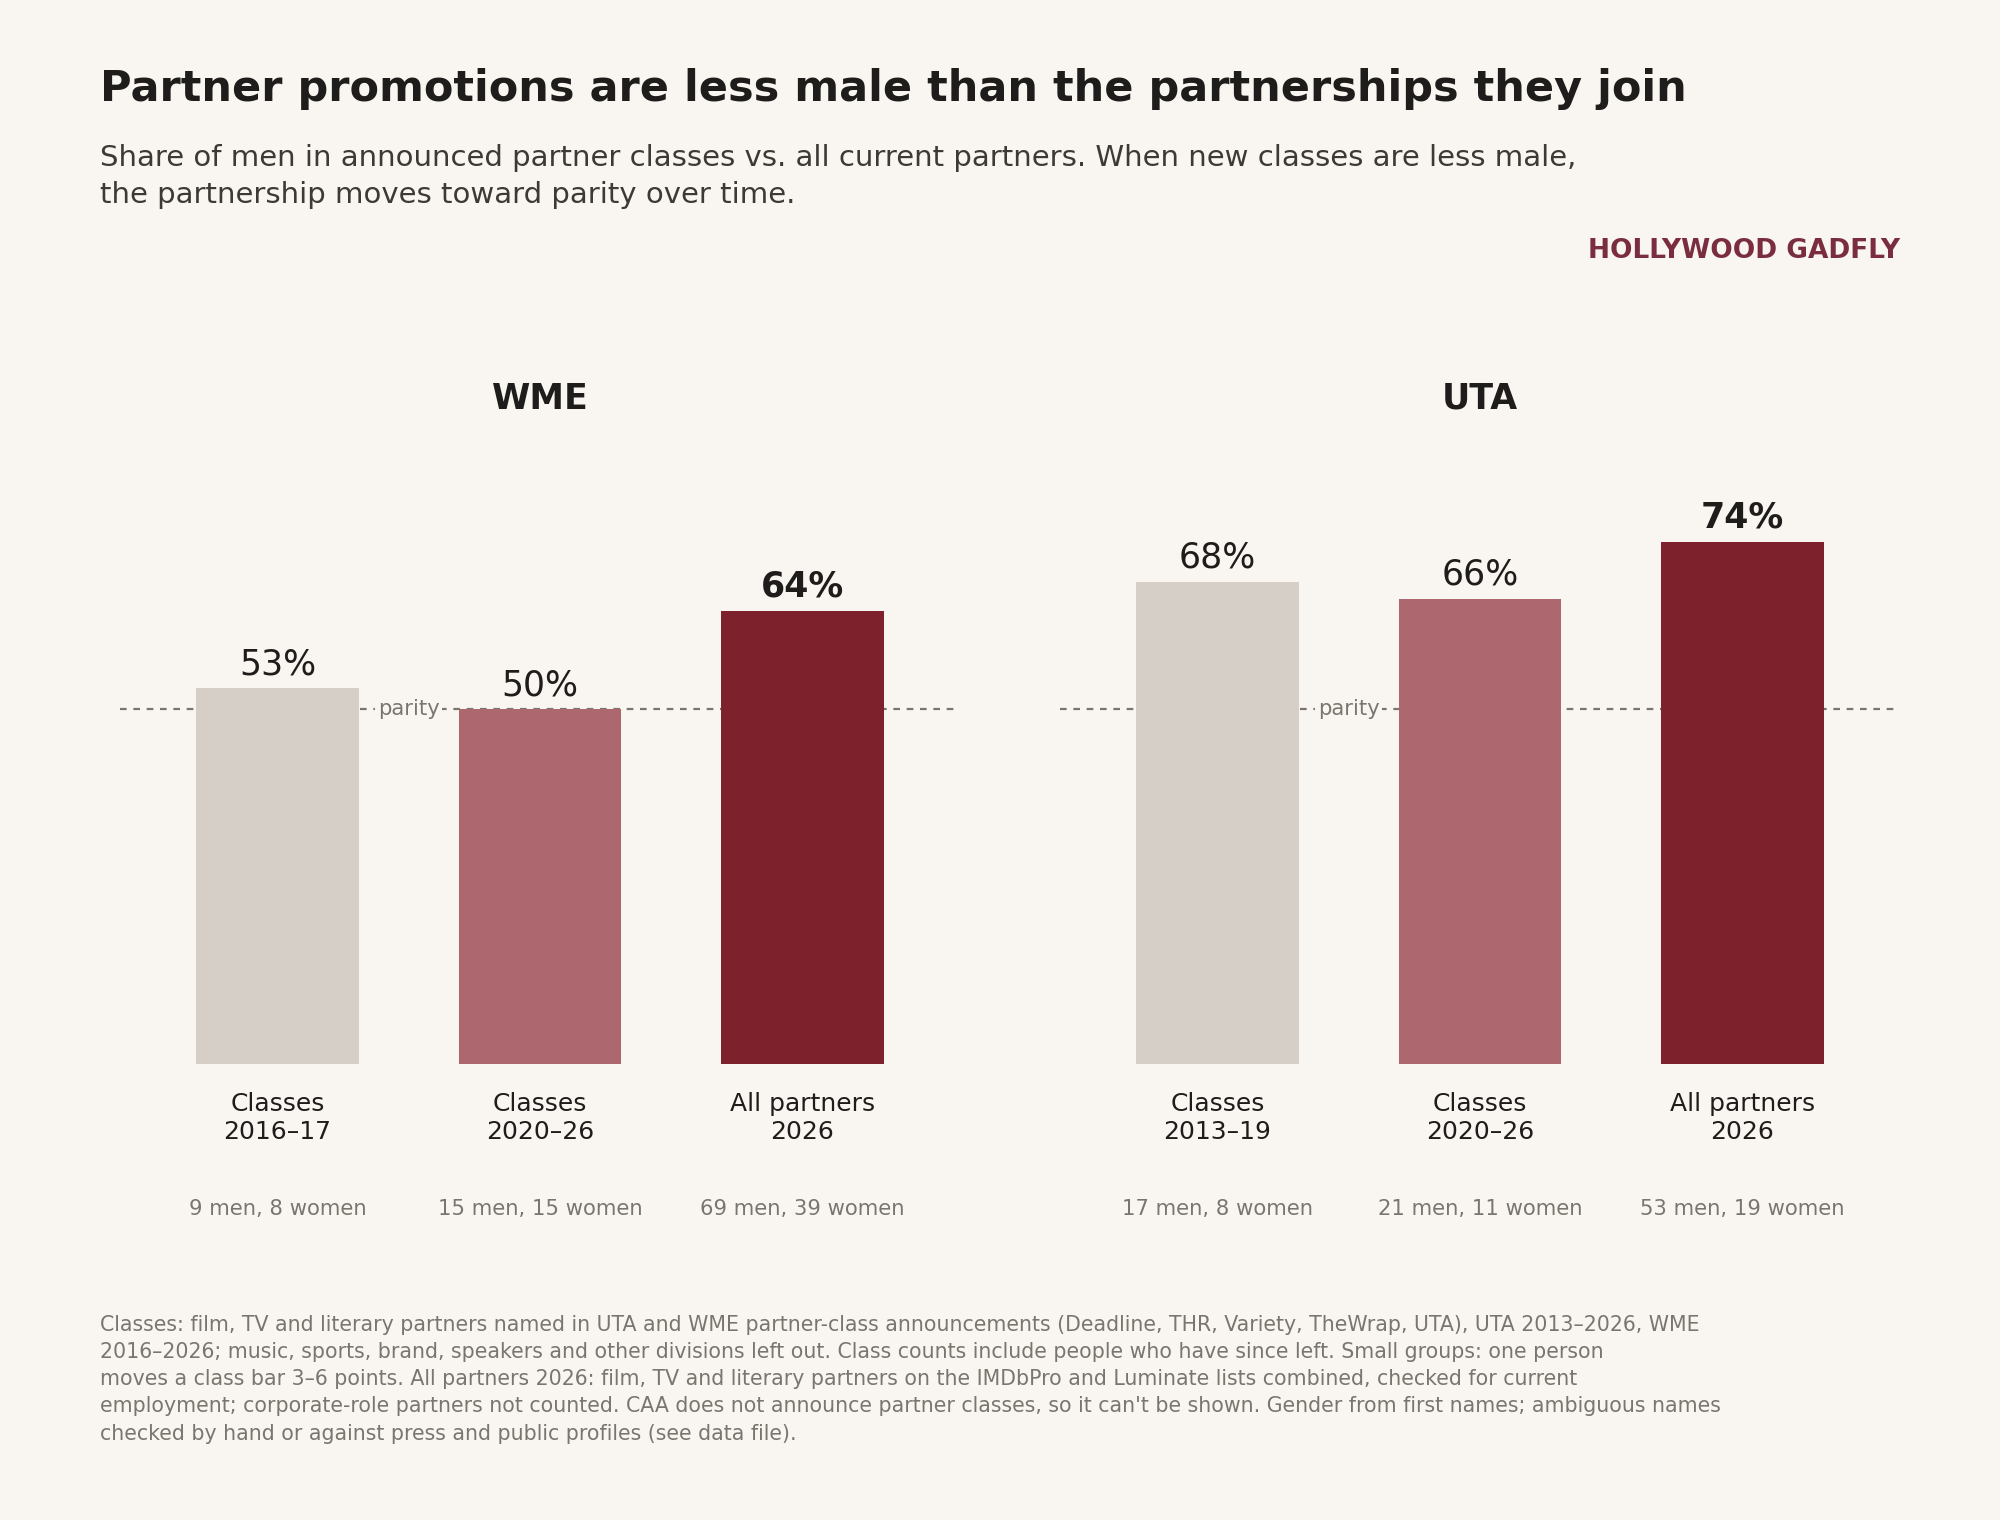
WME’s new partner classes are at parity this decade, and UTA’s male share trended slightly down. CAA doesn’t announce partner classes, and the data I was able to find was very thin, so I have not included it.
But that’s at the very top. Let’s look one level down, at the individual agents:
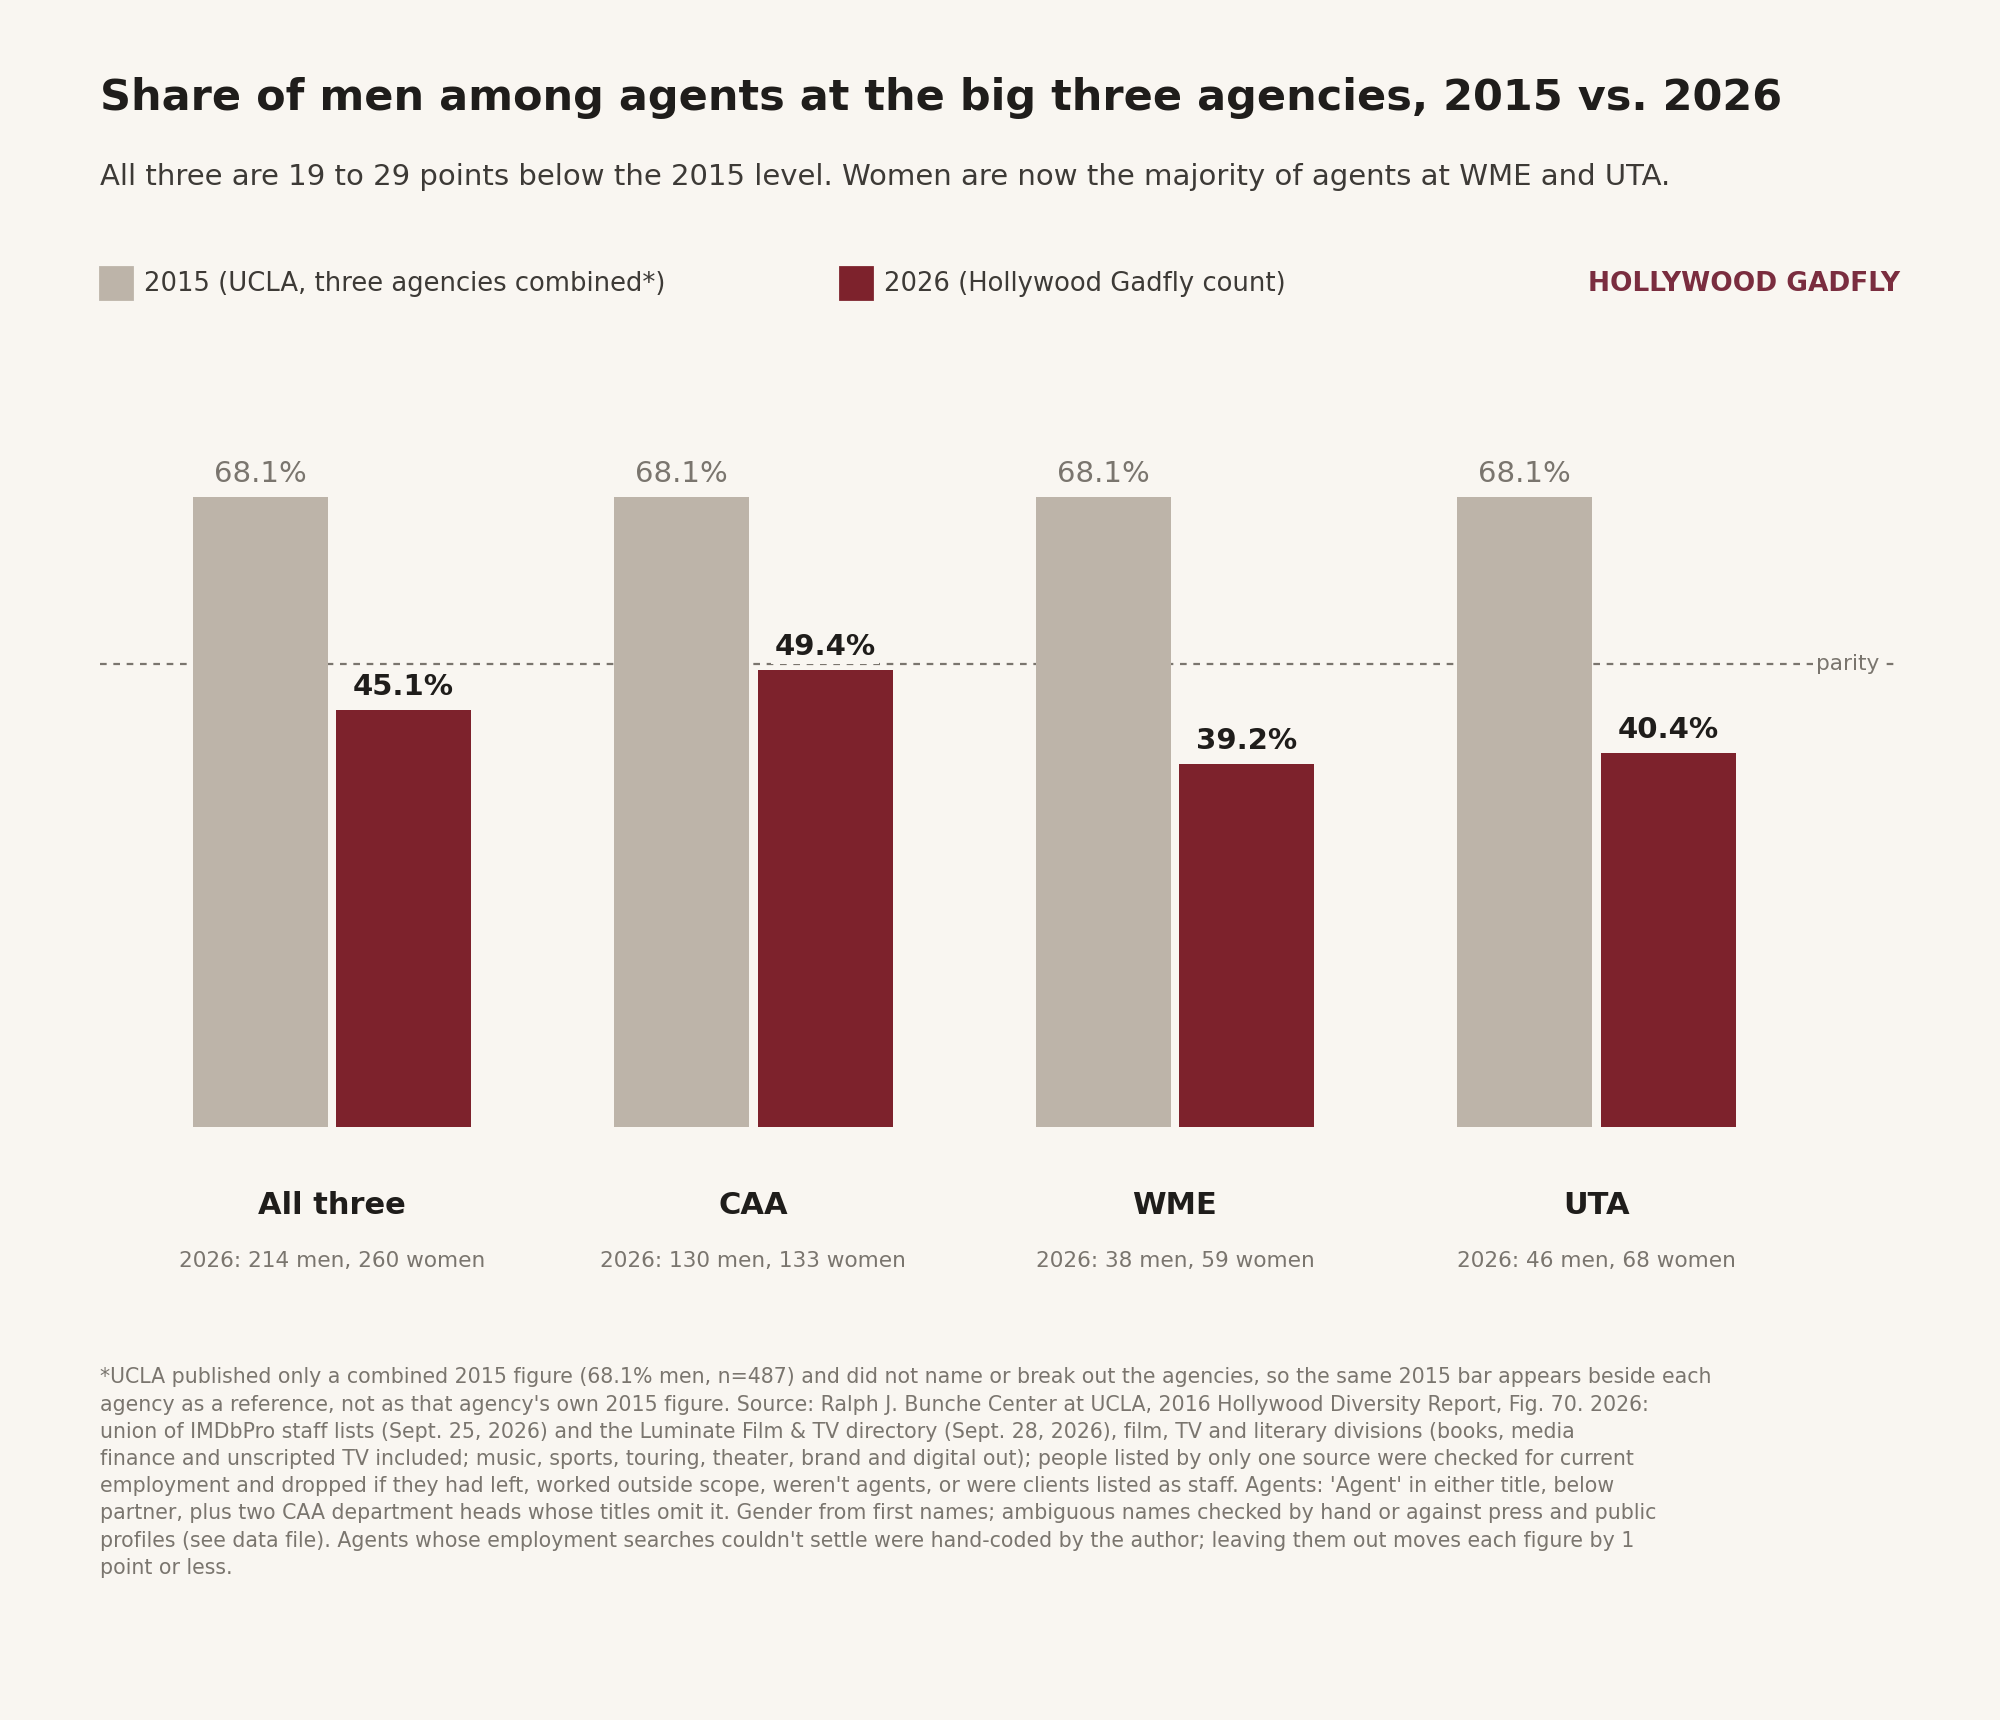
The change is striking. At the agent level, not only is CAA at parity, but WME and UTA are now majority female, at about 60% each.
If reps champion voices that feel familiar to them, then the reps themselves are already at or beyond gender parity at the top 3 agencies, at least below the partner level.
Clients
UCLA did not publish gender figures for the top 3 agency client lists, but I was able to pull the numbers for 2026:5
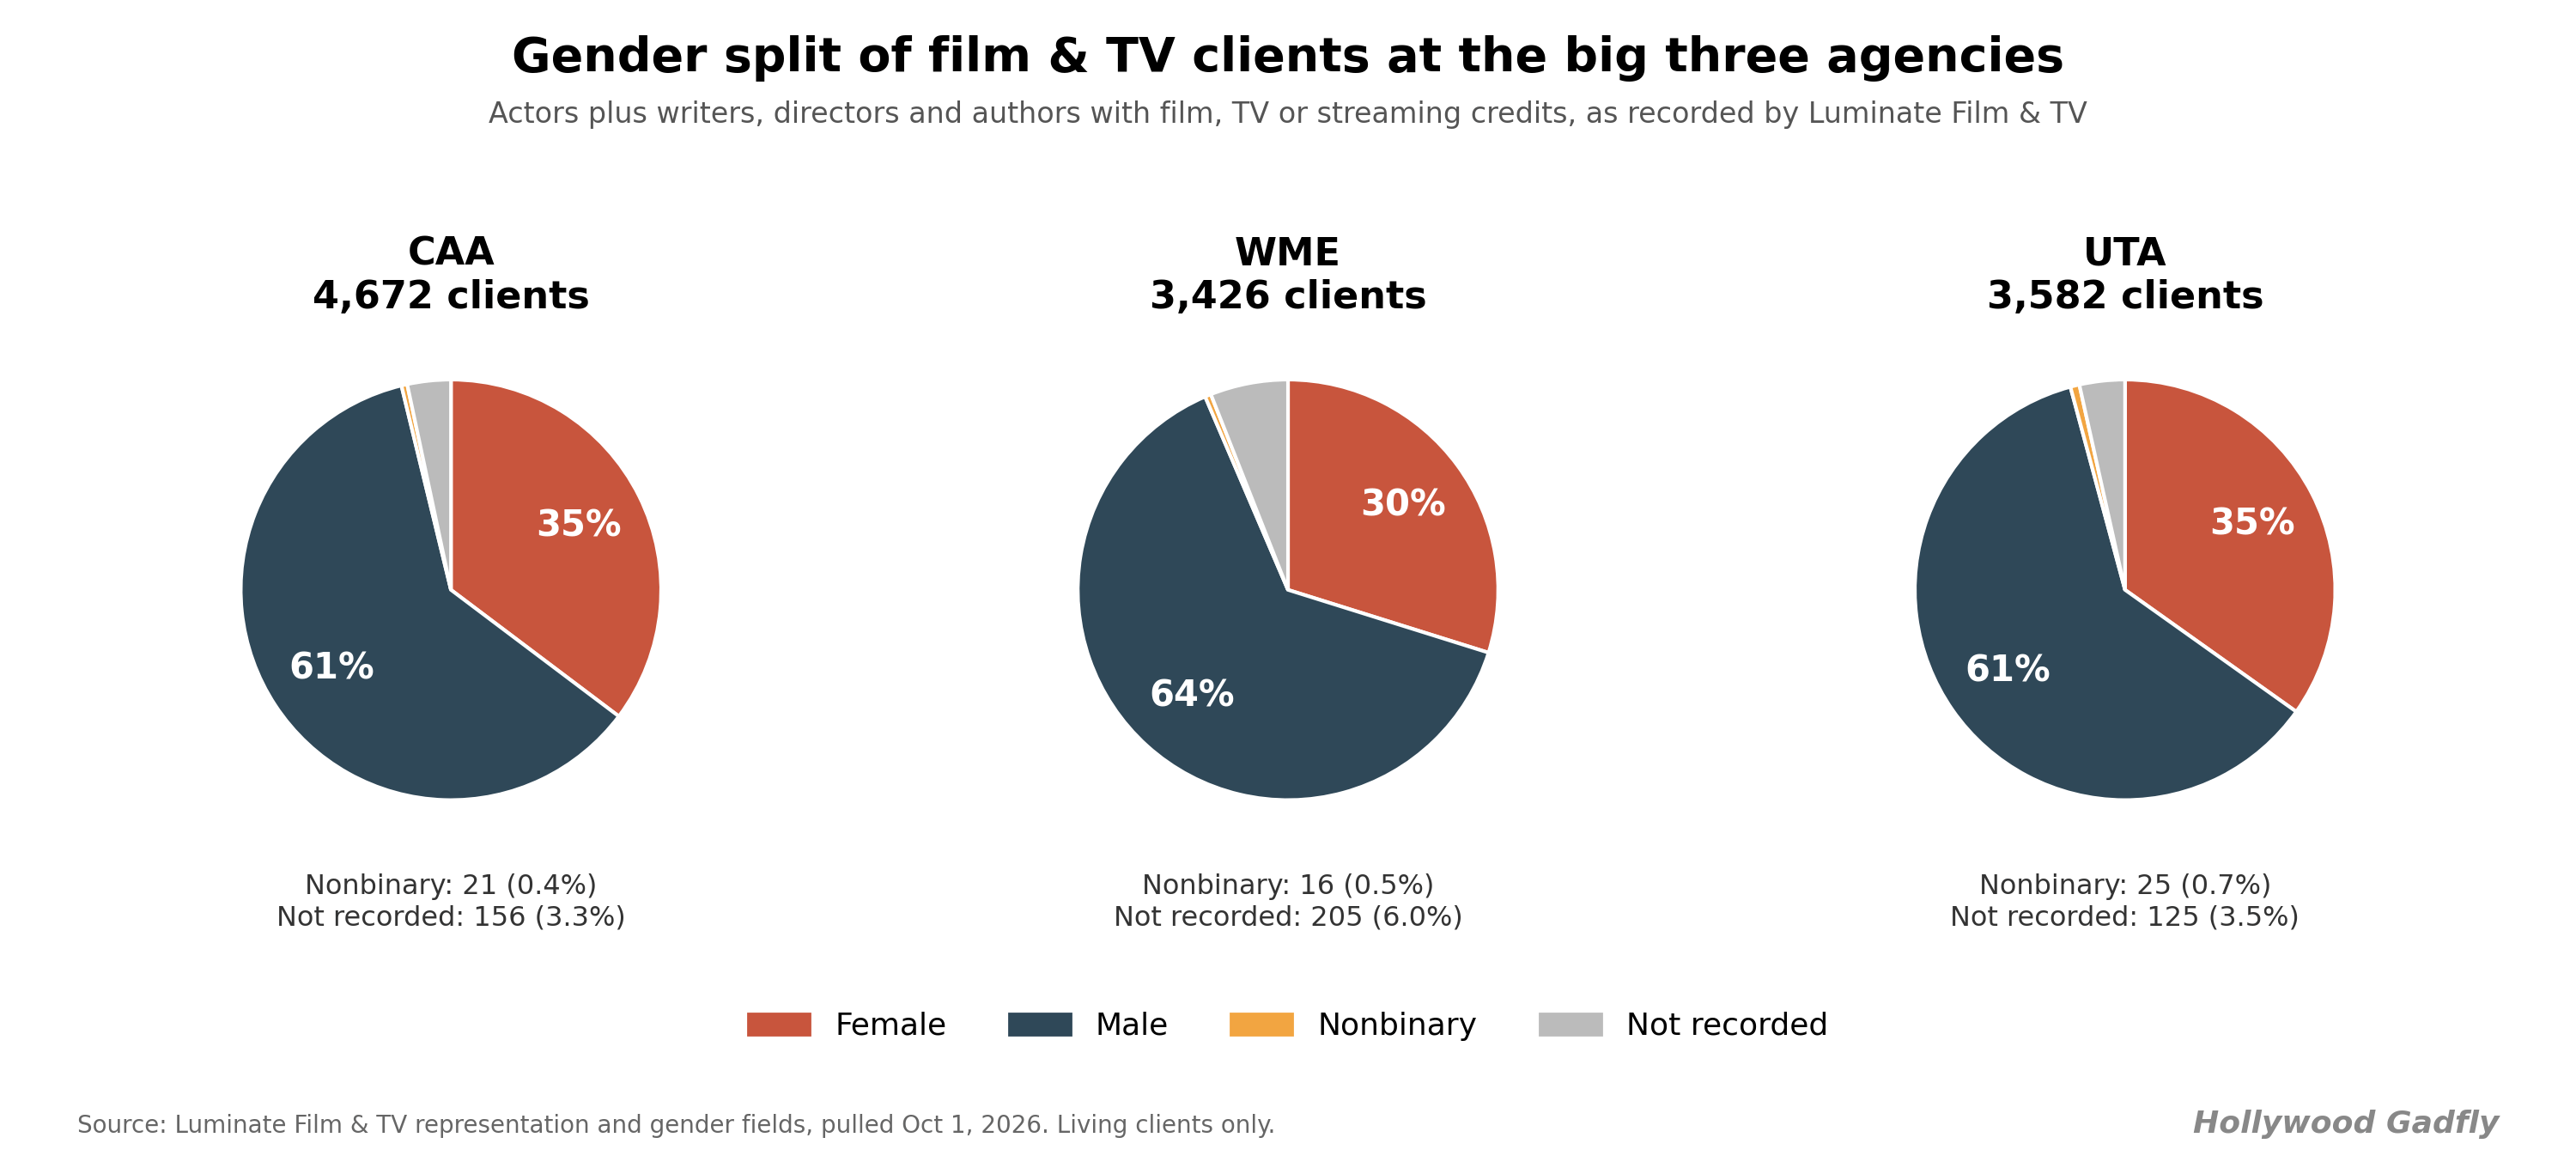
As you can see, women are now about one third of clients at the major agencies. As David suspected, if we break out the clients into individual agents, there is indeed a large disparity between men and women’s client lists:
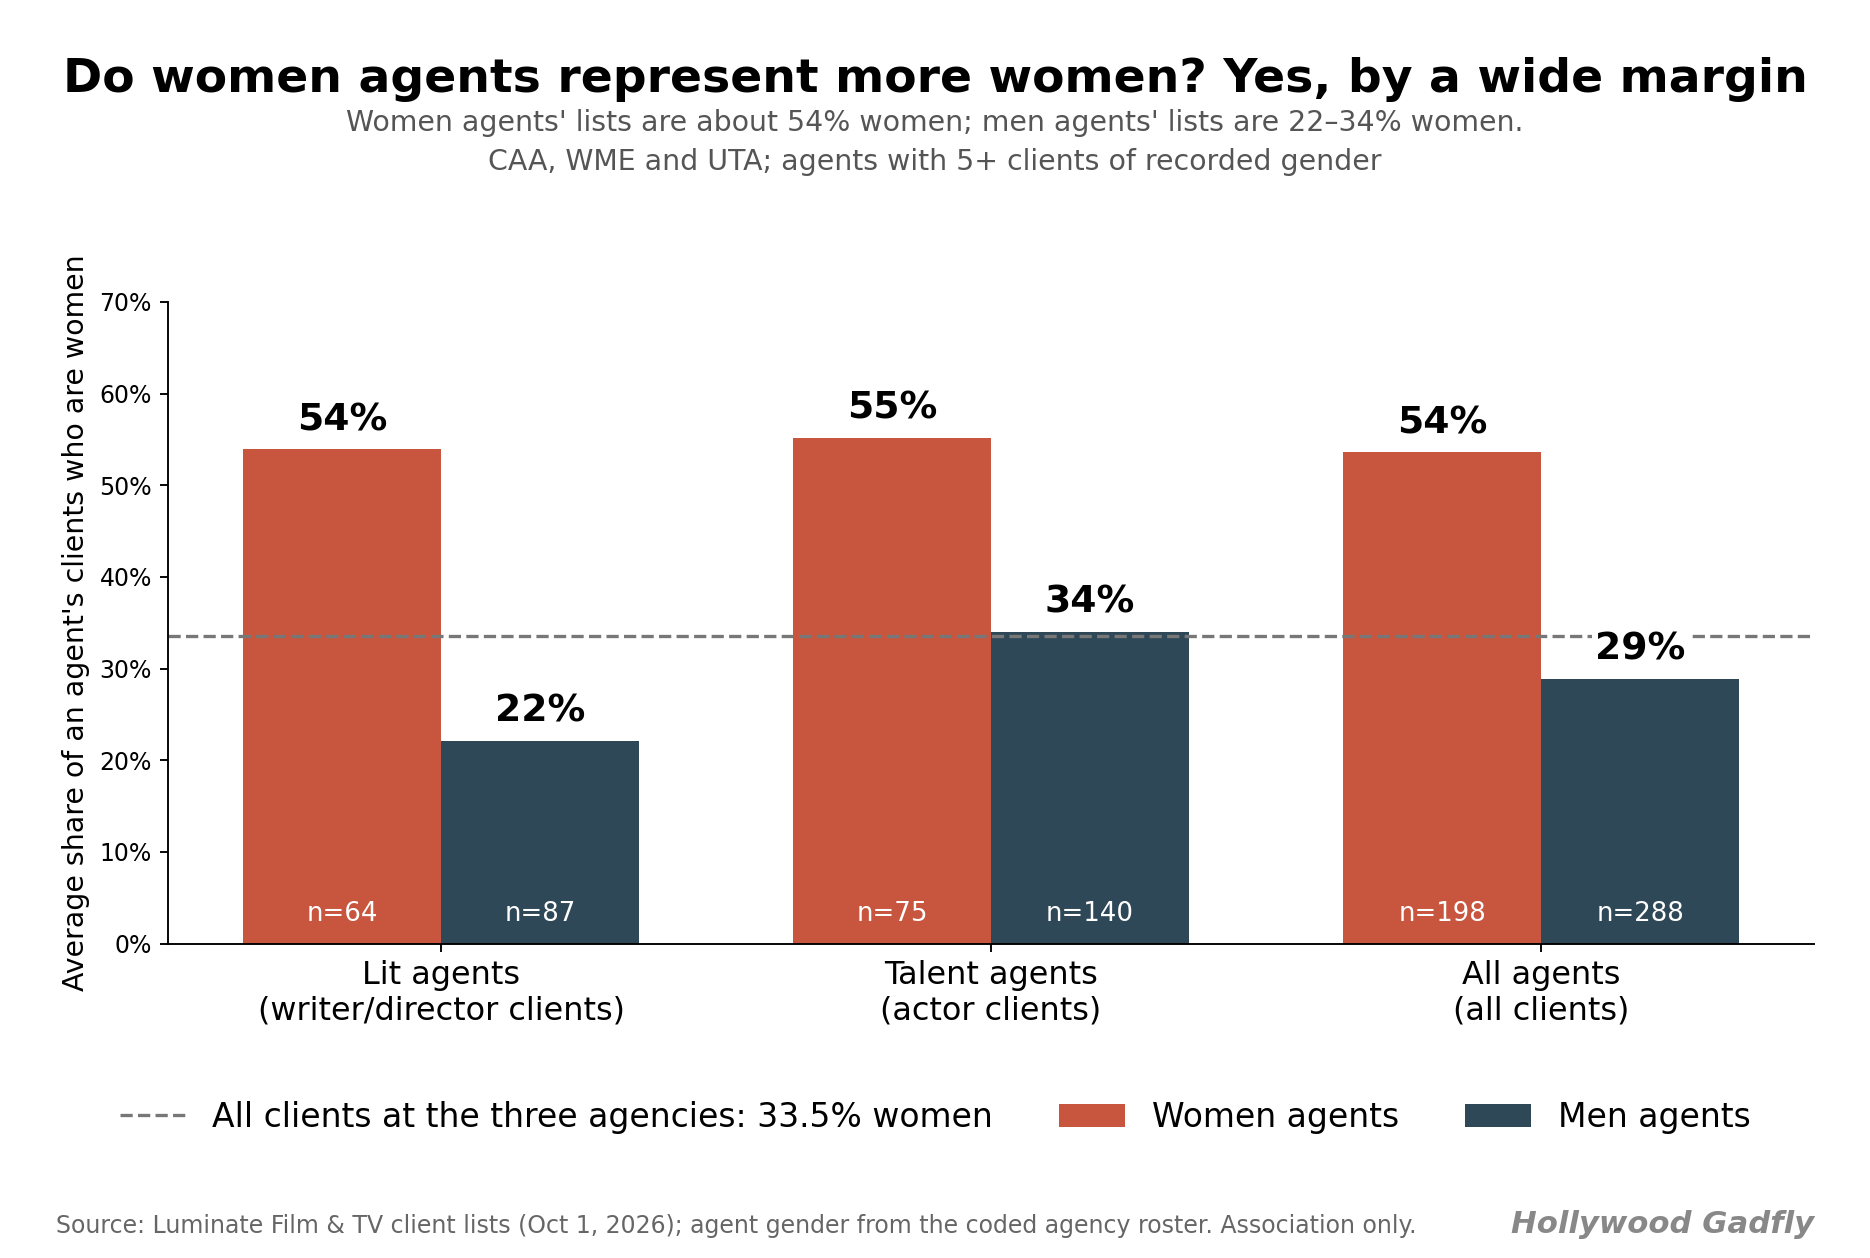
Women’s client lists are 54% women, against a 35% base rate. Men’s lists are lower, at 27%, closer to the market average.
It turns out affinity-bias may well be real, but we have to keep in mind that male agents also tend to have significantly more clients than their female colleagues, with a mean of 41.9 for men against 27.4 for women.
Even after controlling for seniority, agency, and agent type, women’s client rosters are still about 38% shorter than men’s.
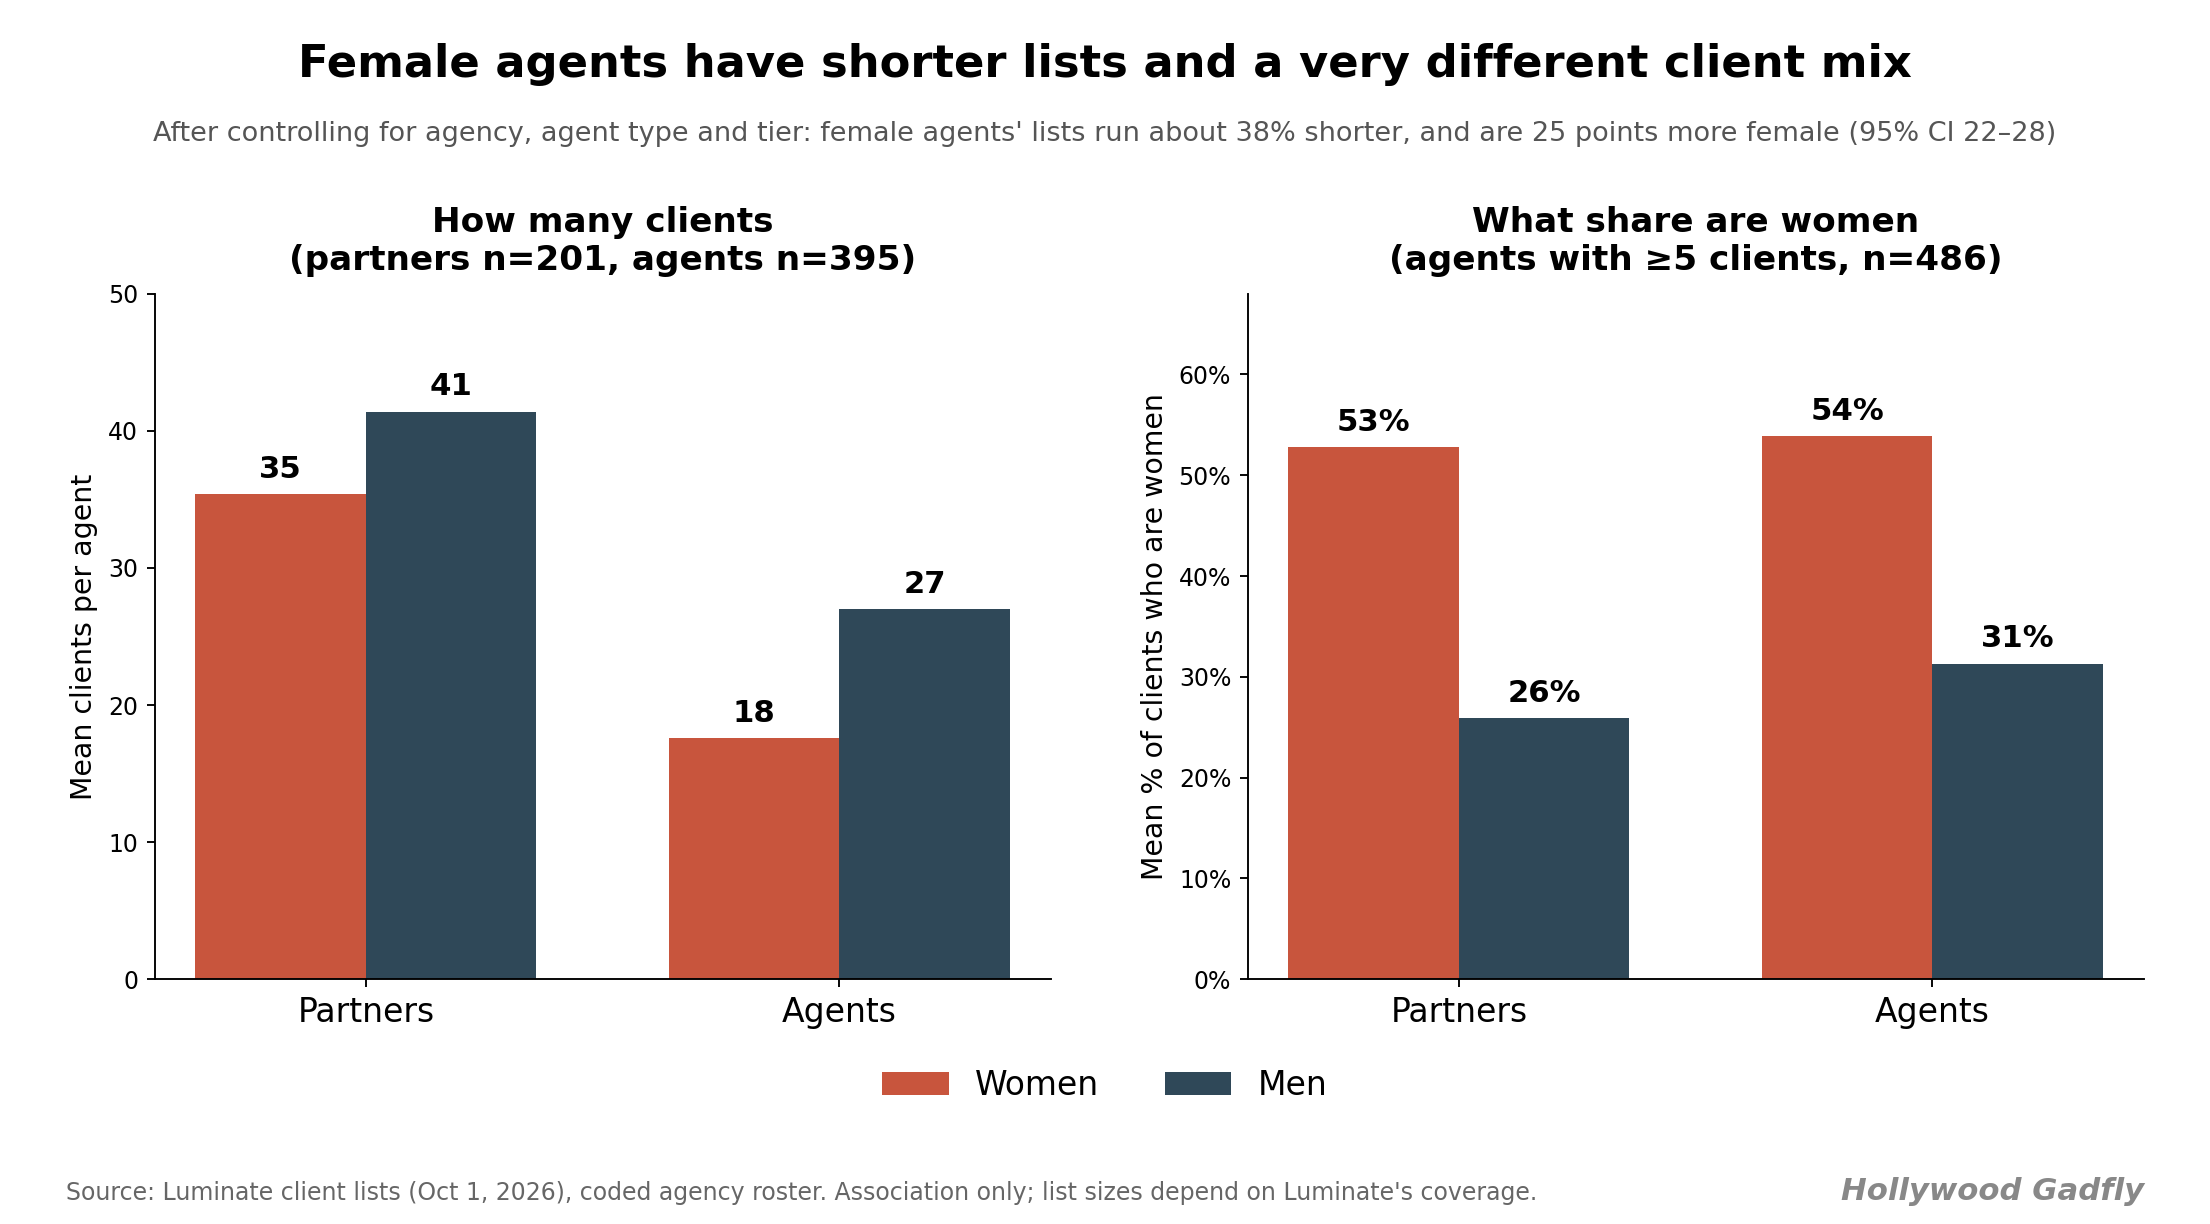
Because their lists are shorter, their rosters move the numbers less. The average female agent represents about 15 women, while the average male agent represents about 12.
Swap them one roster gains roughly three women, while losing about 17 men.
Most of the percentage gap thus comes from men’s longer, male-heavy lists, not from women signing more women.
So more female agents shifts the client mix, just a lot more slowly than the numbers would suggest.
Executives
The executive ranks reveal another important change; we now have many powerful women at the highest levels of the industry.
I ran the numbers on the most powerful executives in every major studio and streaming company. I also pulled the 2015 numbers to compare:6
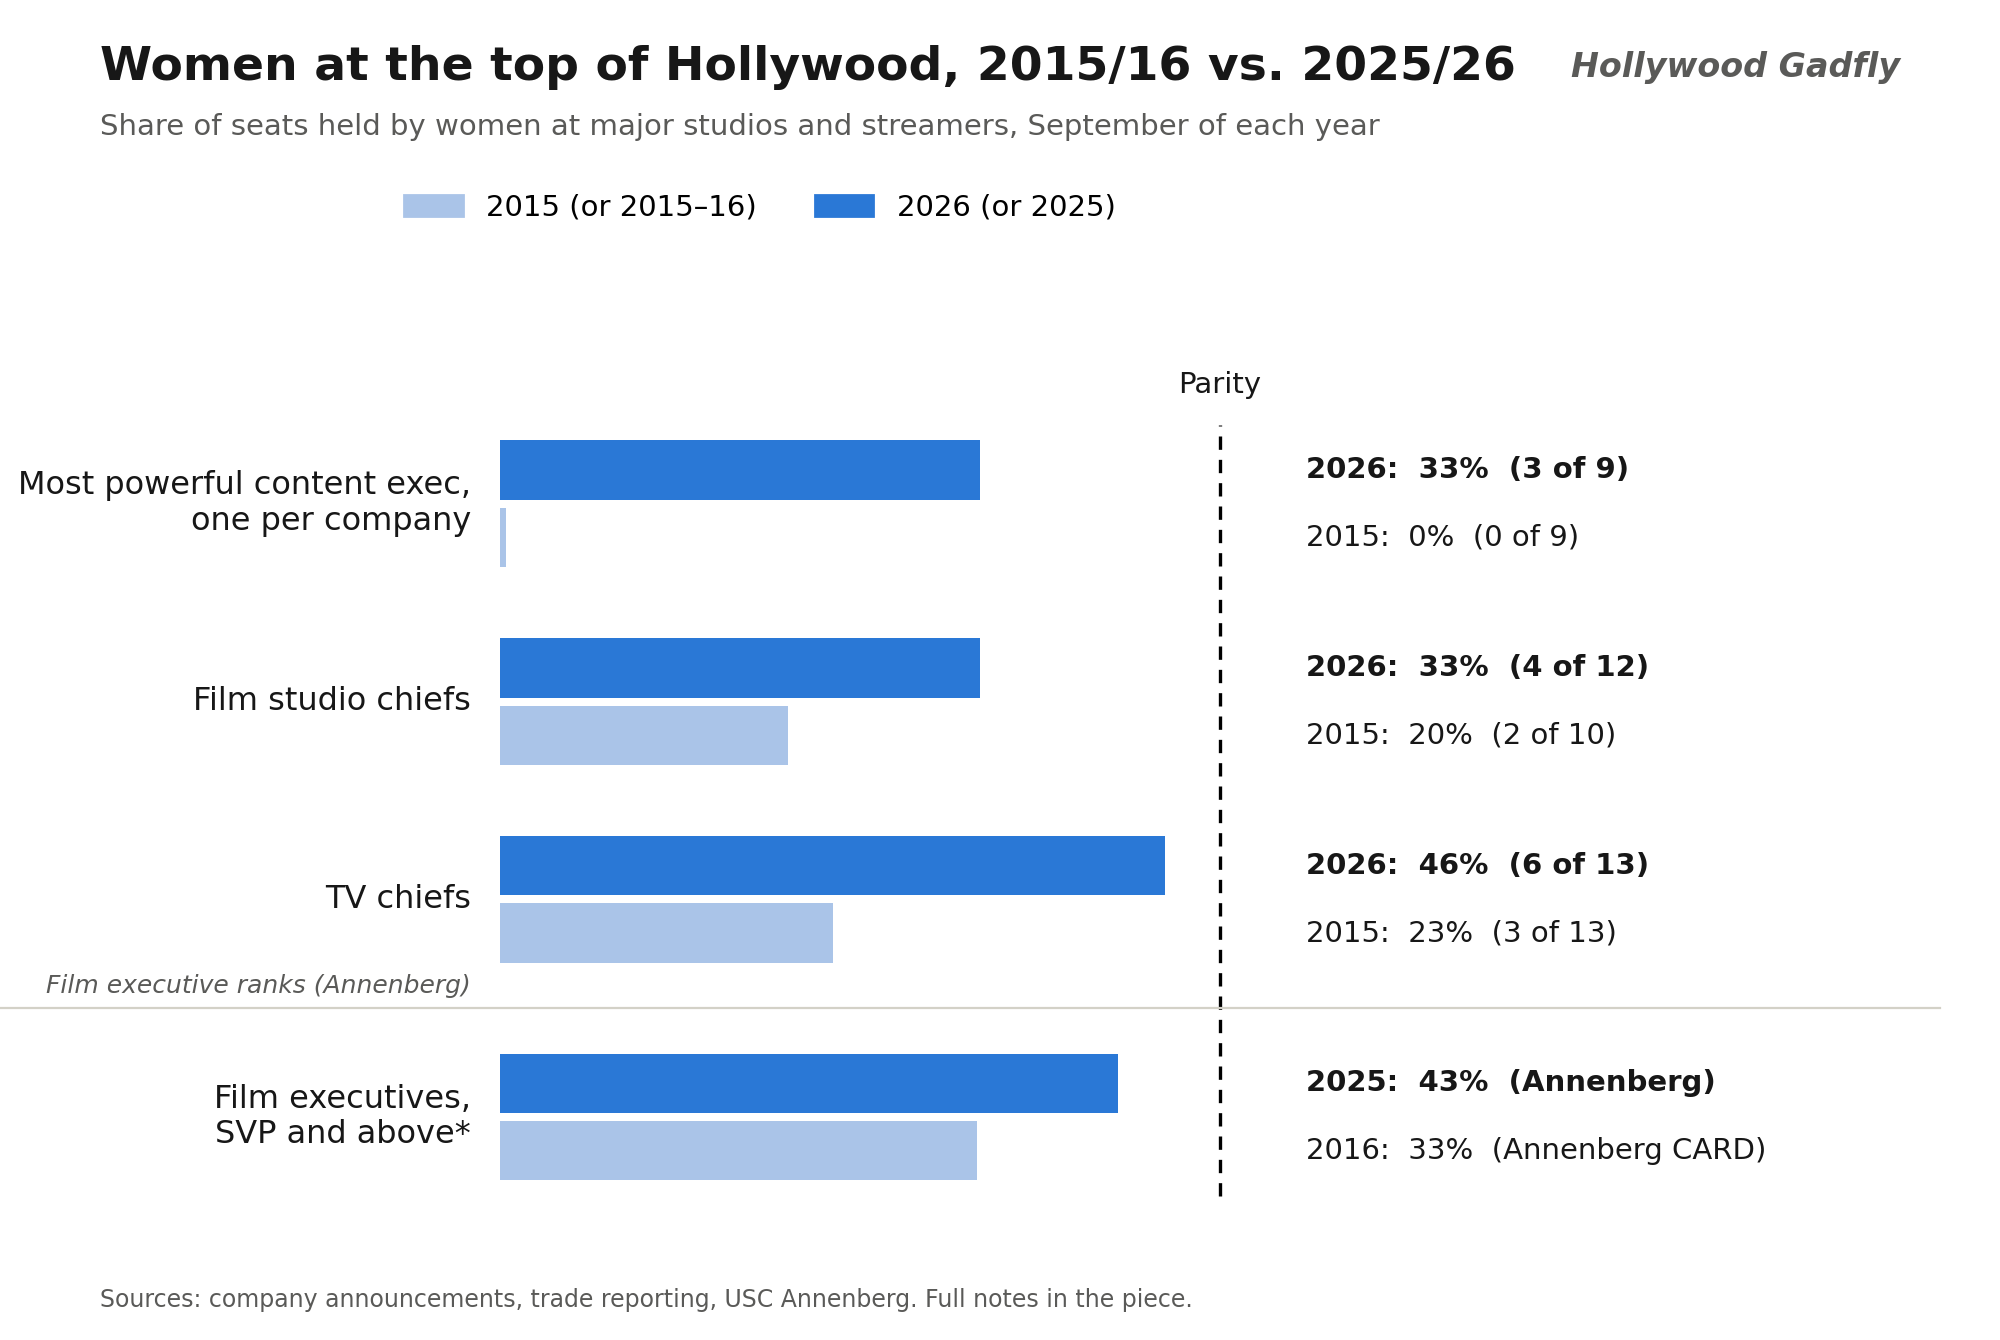
Since 2015, the number of female TV chiefs has doubled, and is basically at parity. The number of female film chiefs also doubled, and the share of women among the most powerful content execs went from 0 to 33%. There are only 34 of these seats in total, so one person flipping here or there has an outsized impact.
Women’s share of SVP-and-above film execs also rose by about a third, and is within 7 percentage points of parity.
Part 2: Directors, Writers and Showrunners
Directors
David writes that we have a genuine problem with female directors in 2026. She cites this USC study, which shows that just 8.2% of 2025’s top-grossing films were directed by women.
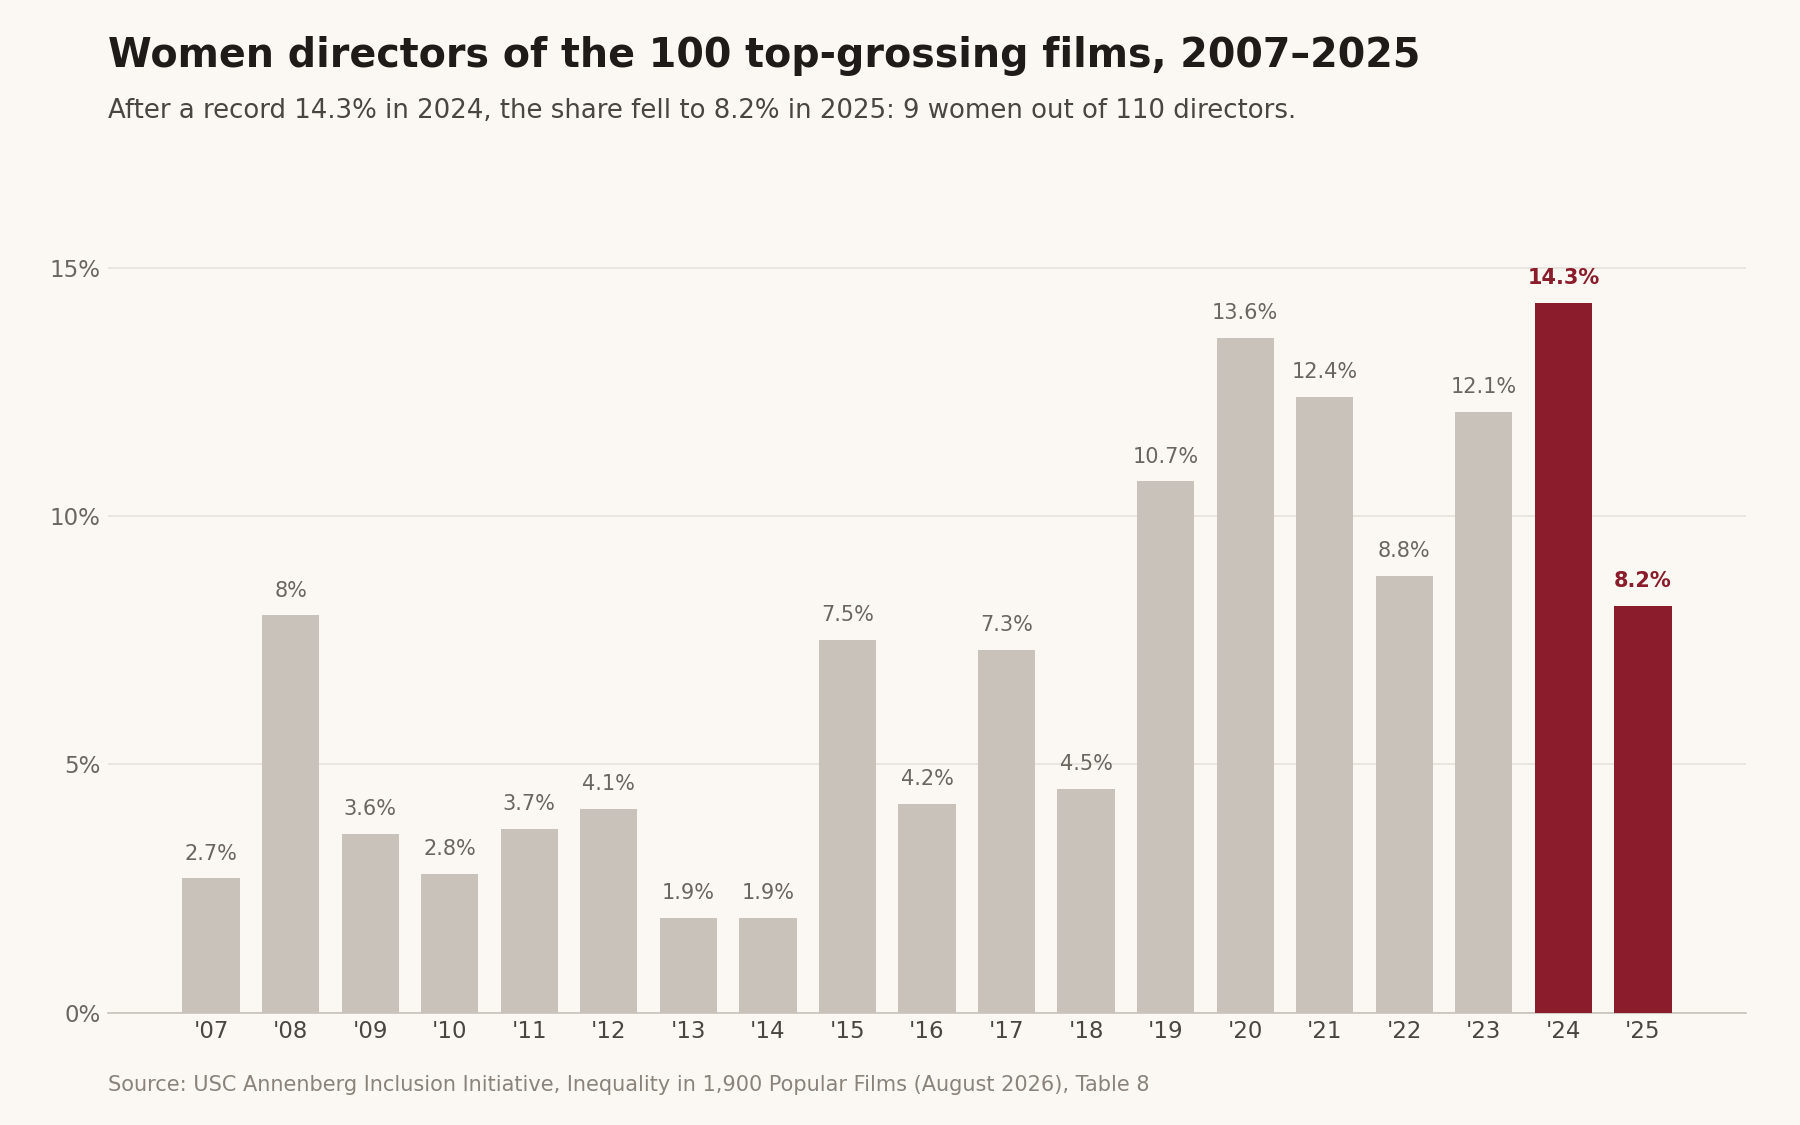
But if you look closely, this means that the best year for women directors was 2024, just two years ago.
Looking at individual years in a dataset this noisy is challenging. A better way is to look by decade:
• 2007-2009: ~4.8% female (USC’s series starts in 2007).
• 2010s: ~4.9%, almost zero progress.
• 2020s so far: ~11.6%. More than double!
So with these numbers in mind, here’s another way of looking at the same chart:
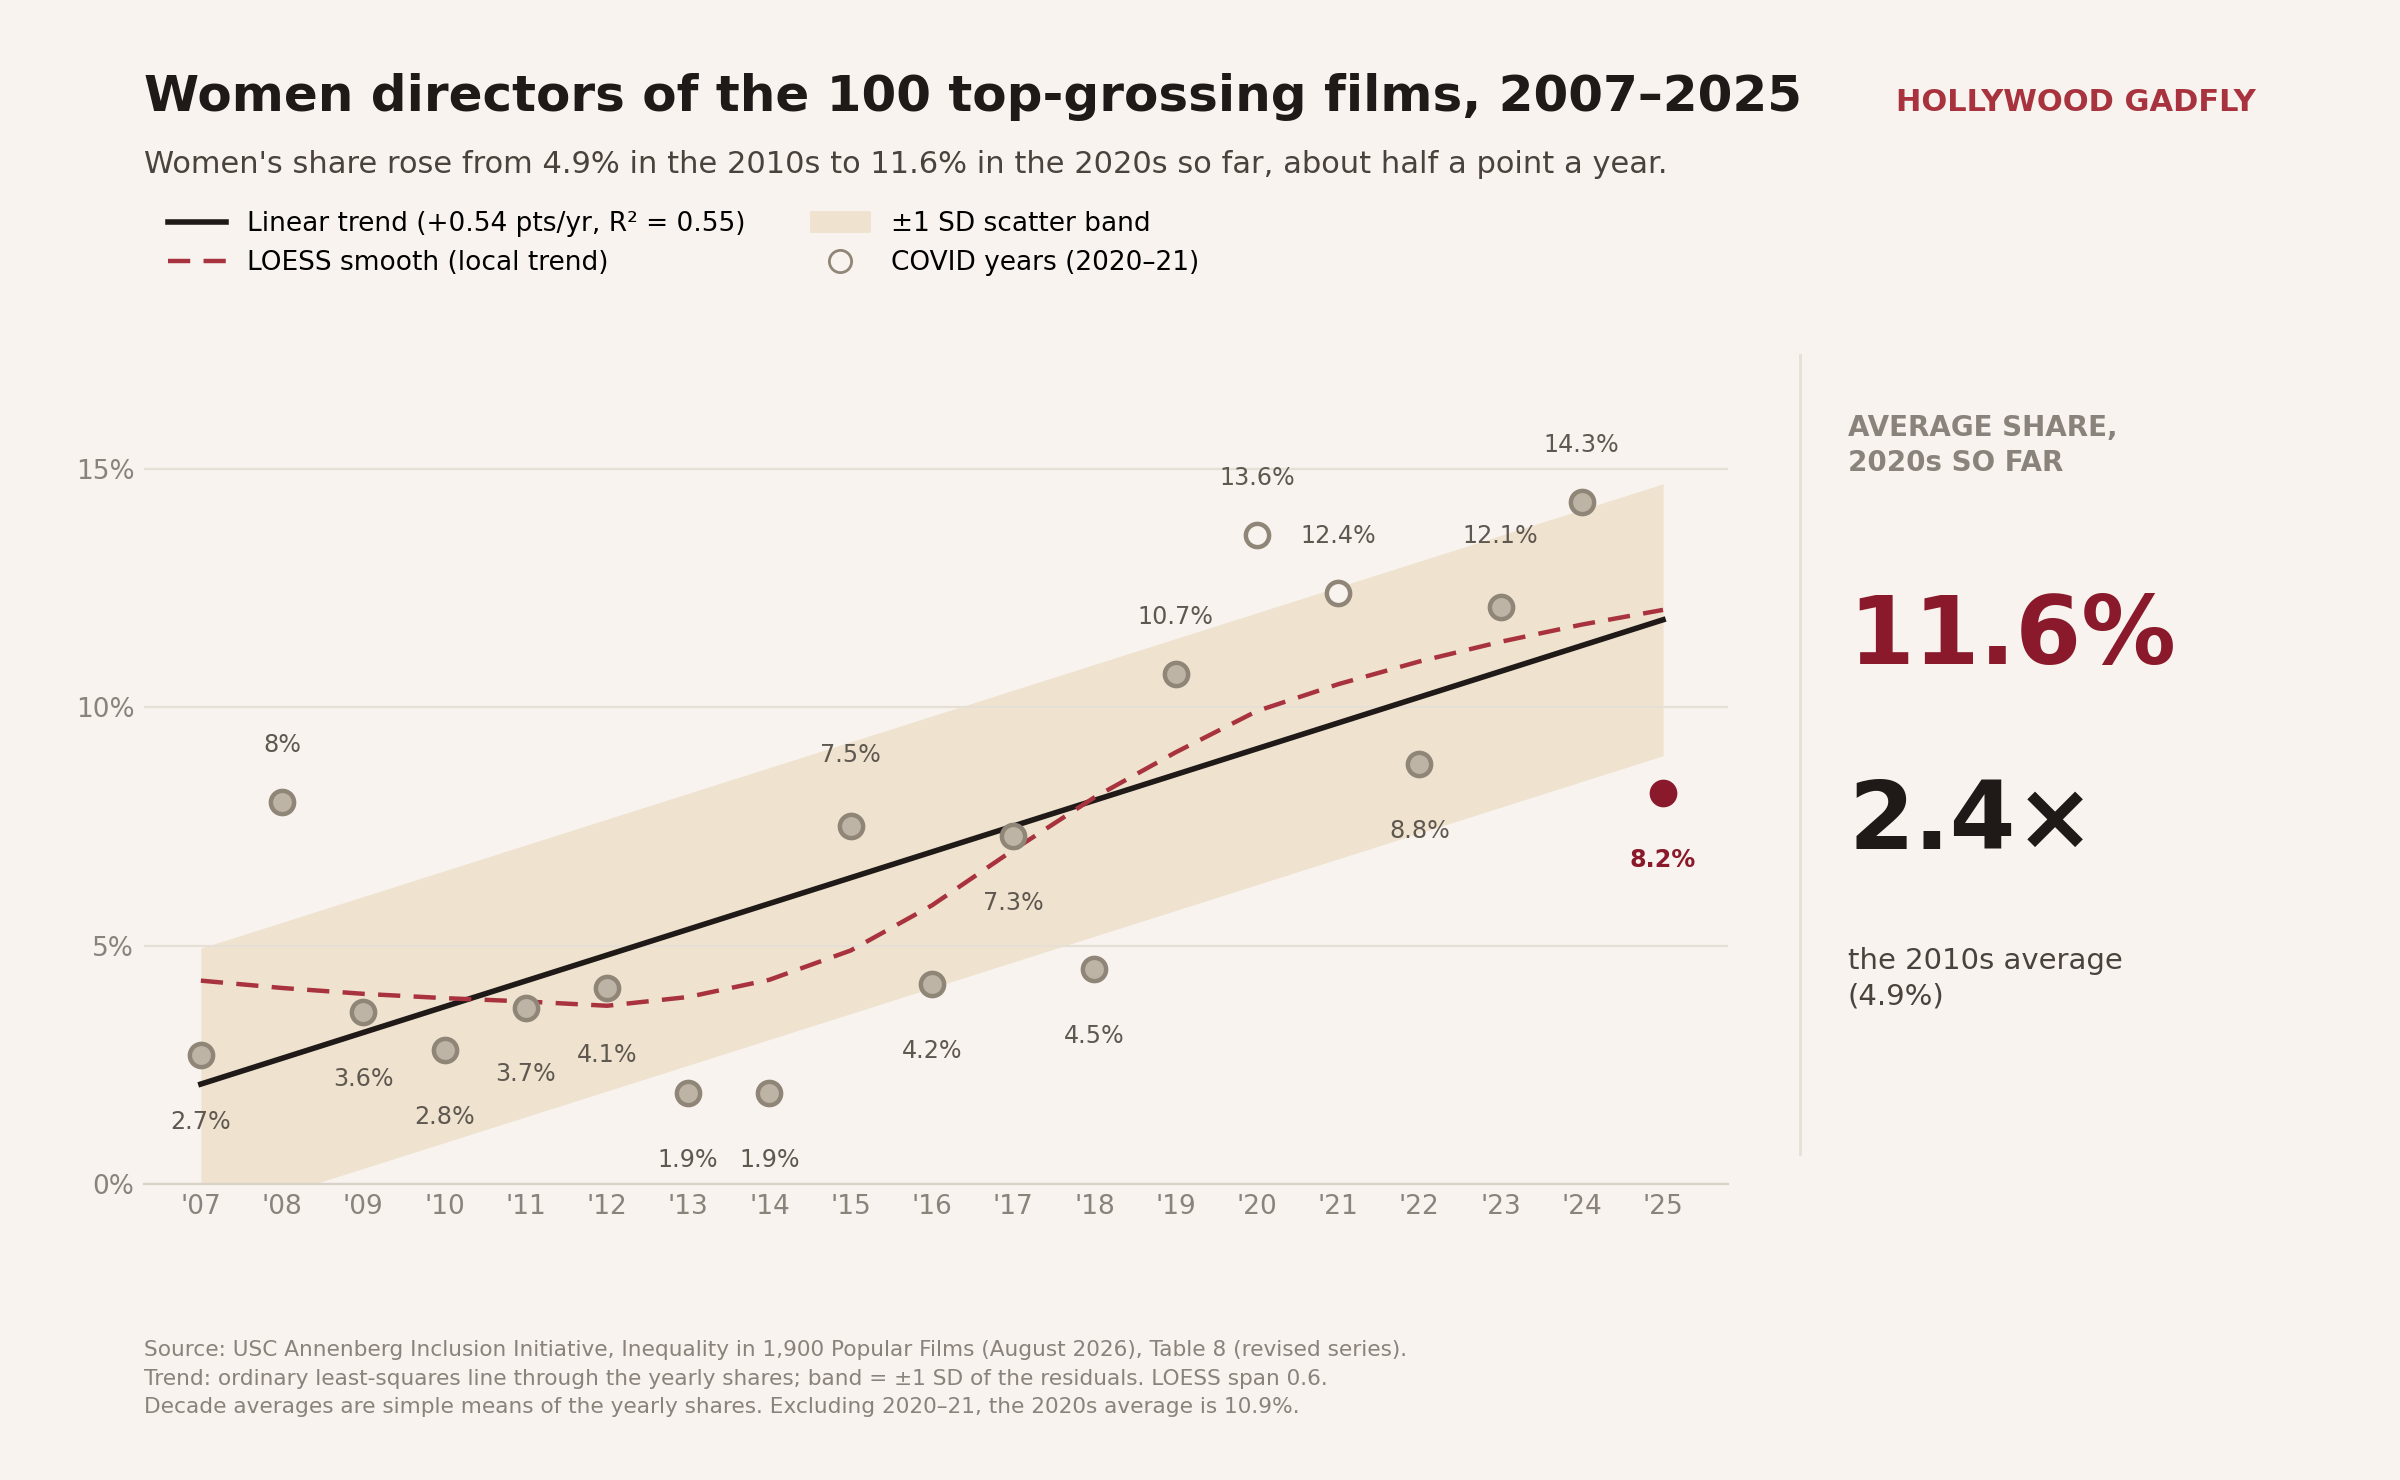
We’re still a long way from parity, but there’s clear improvement, on the order of half a percentage point a year.
Again, even the top is slowly shifting in the right direction.
The Hiring Gap
David writes, citing USC, that:
The report notes most women who direct a top film never get hired for a second one, signaling the hiring gap.
She’s right that there’s a hiring gap. The harder question is why. So let me propose something.
The pool of incumbent blockbuster directors, because of previous, more discriminatory eras, skews heavily male.
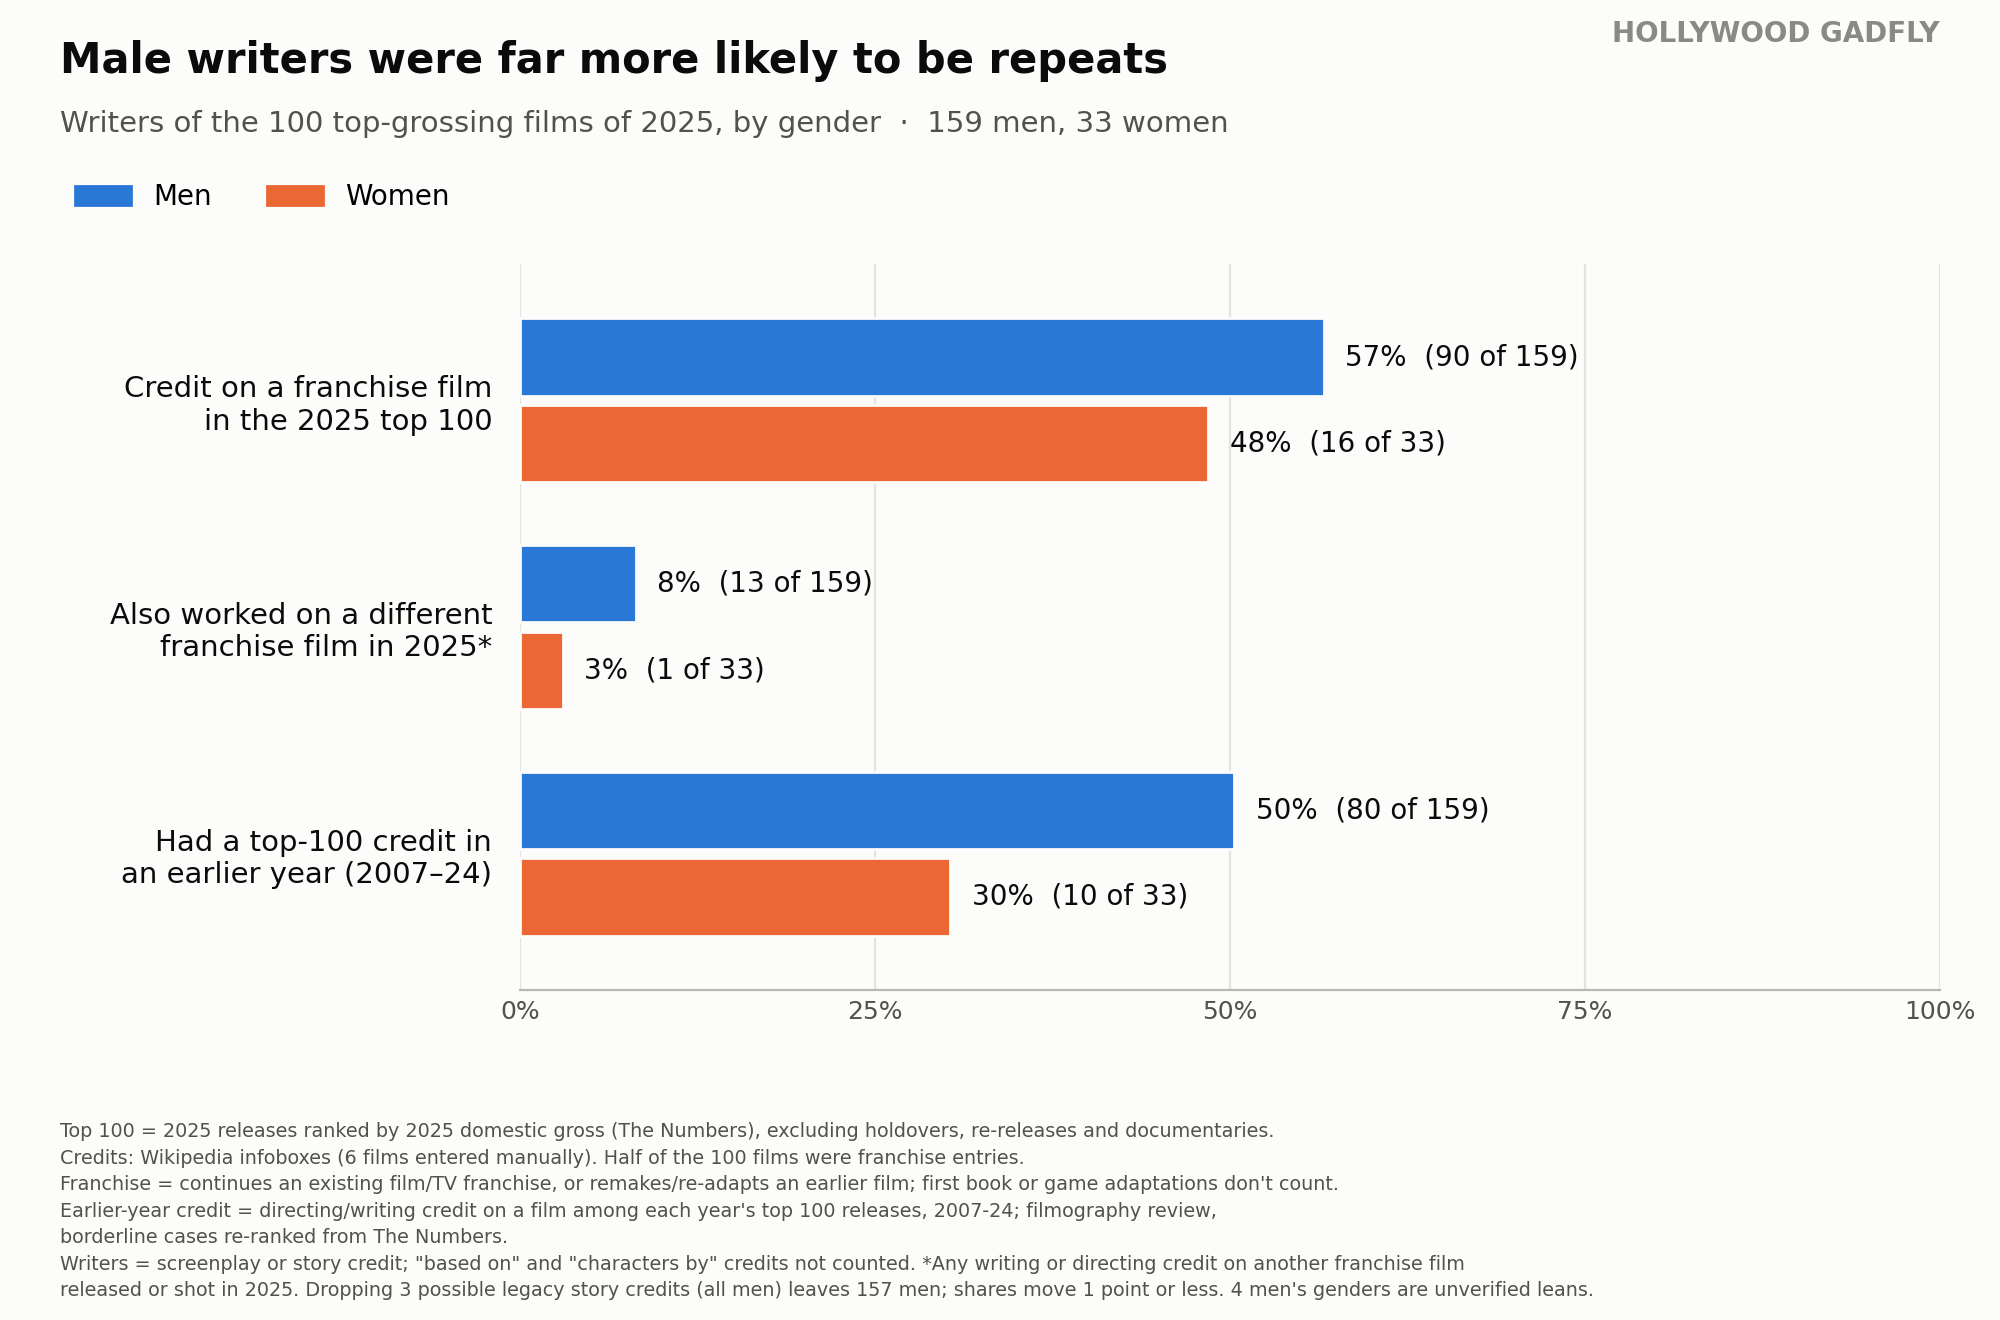
I broke down the 2025 top 100 directors to see how many had already worked on a prior top 100 film, which are largely giant franchises.
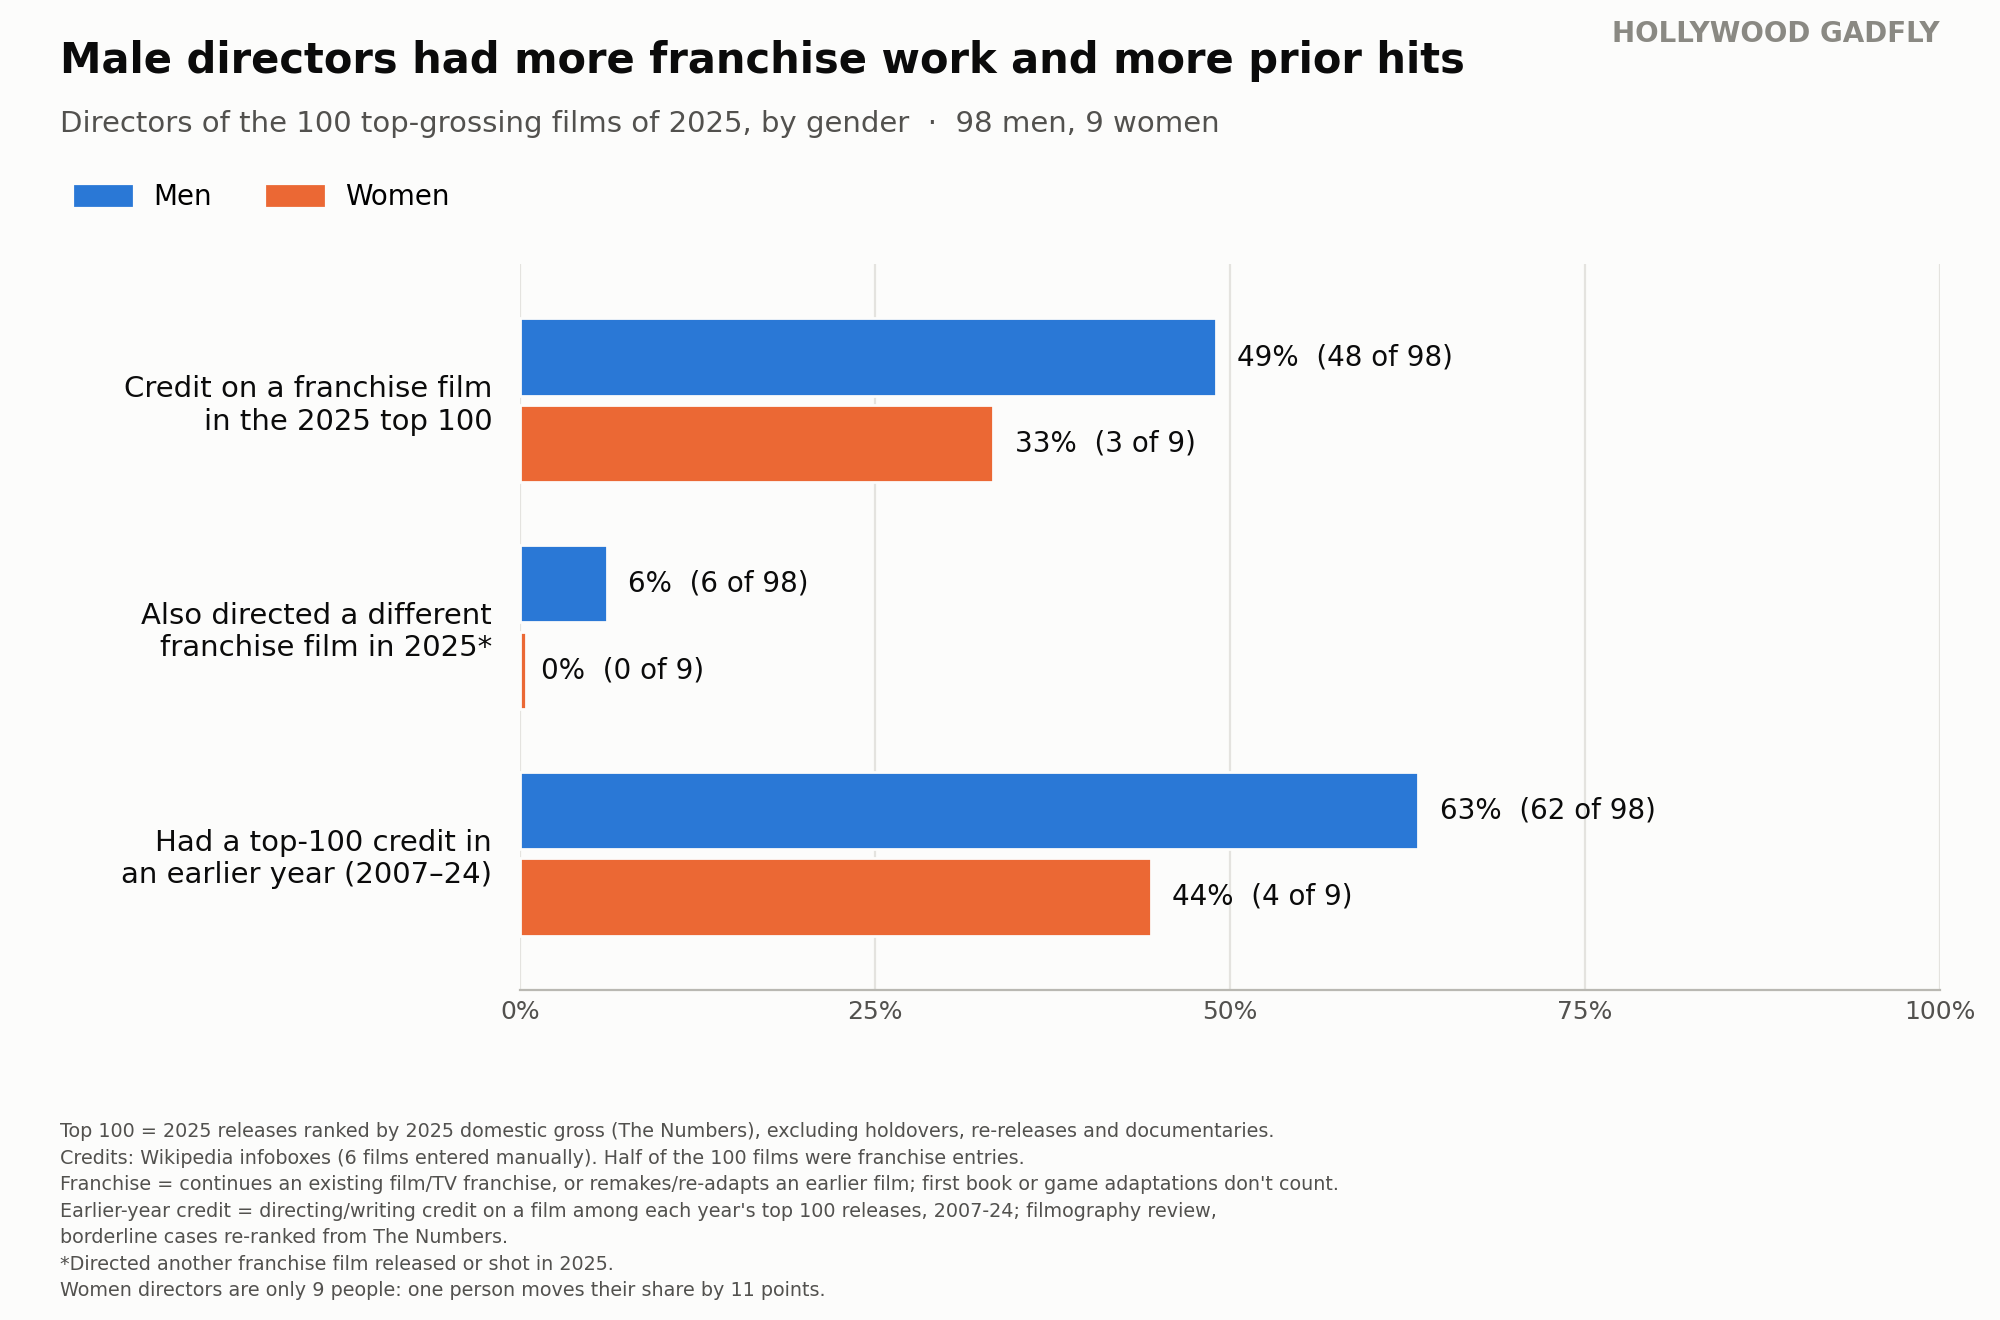
63% of men had an earlier top 100 credit, compared with 44% of women.
This makes sense, because the biggest predictor of blockbuster success is track record. And indeed, if we compare men’s and women’s experience levels in the top 100, the women were overall less experienced.
Another obvious explanation is that women only really started breaking into the top 100 around 2019. It takes at least three to five years to make a feature film, so we likely haven’t even seen the next projects from our female classes of 2022 onward, including 2024, the largest female year on record.
I checked the ages of the top one hundred female directors this decade, and they are indeed significantly younger than the men, on average by about 8 years.
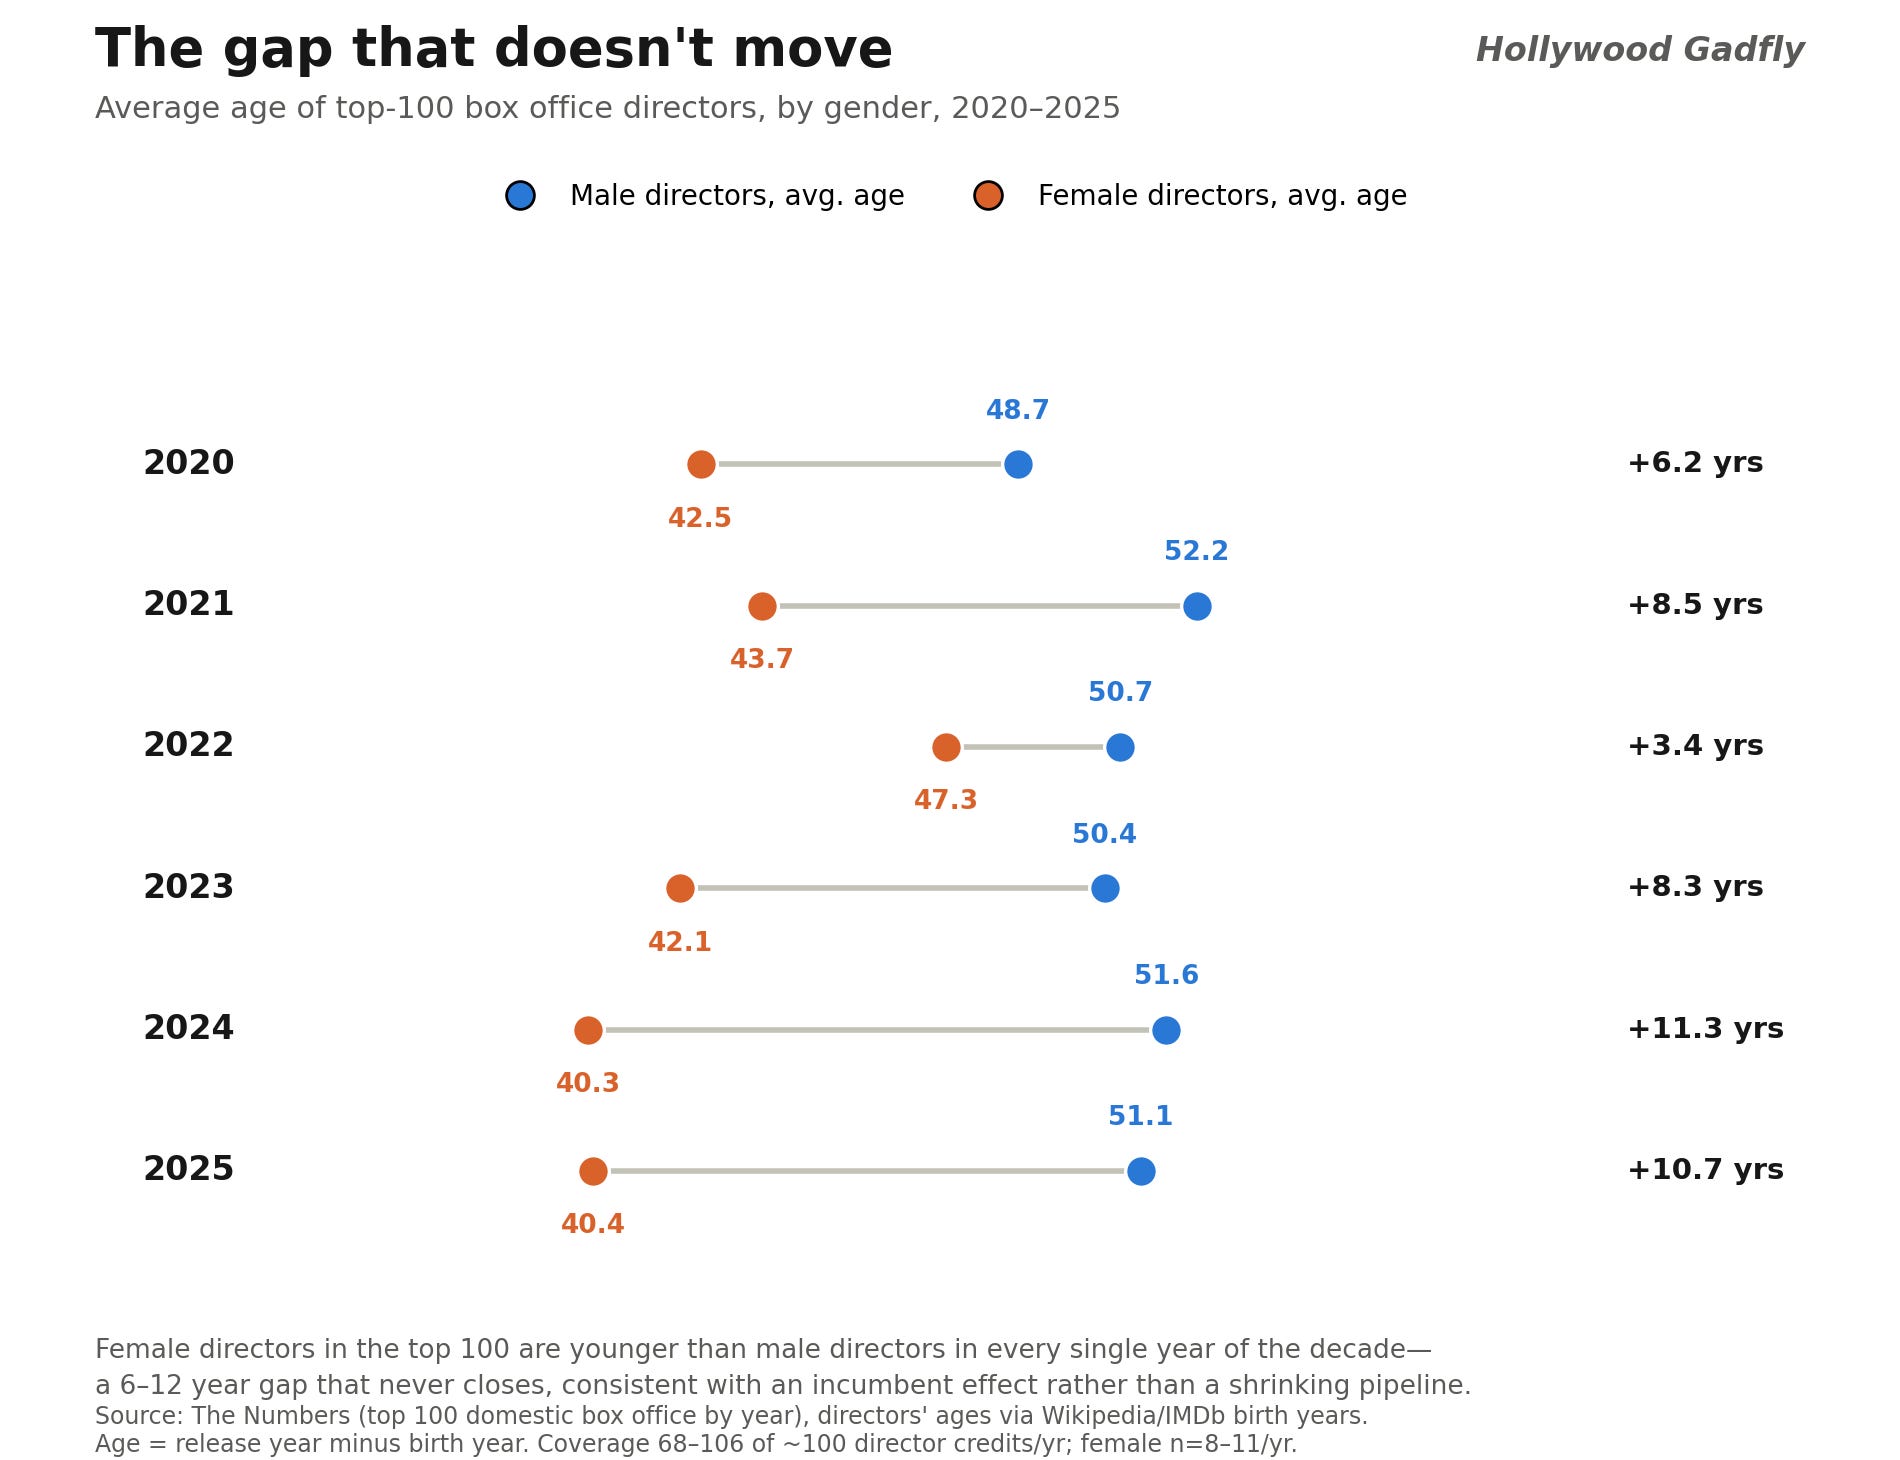
This all points to even more progress ahead.
So what does explain the director gap? I dug in hard to this question and the answer simply grew too large to fit this piece. So stay tuned for a deep dive on the director gap and the factors contributing to it in another post.
Writers
In 2025, women were only 16% of the top 100 feature writers. Here is the USC chart David cites, modified with a trendline and average share by decade.
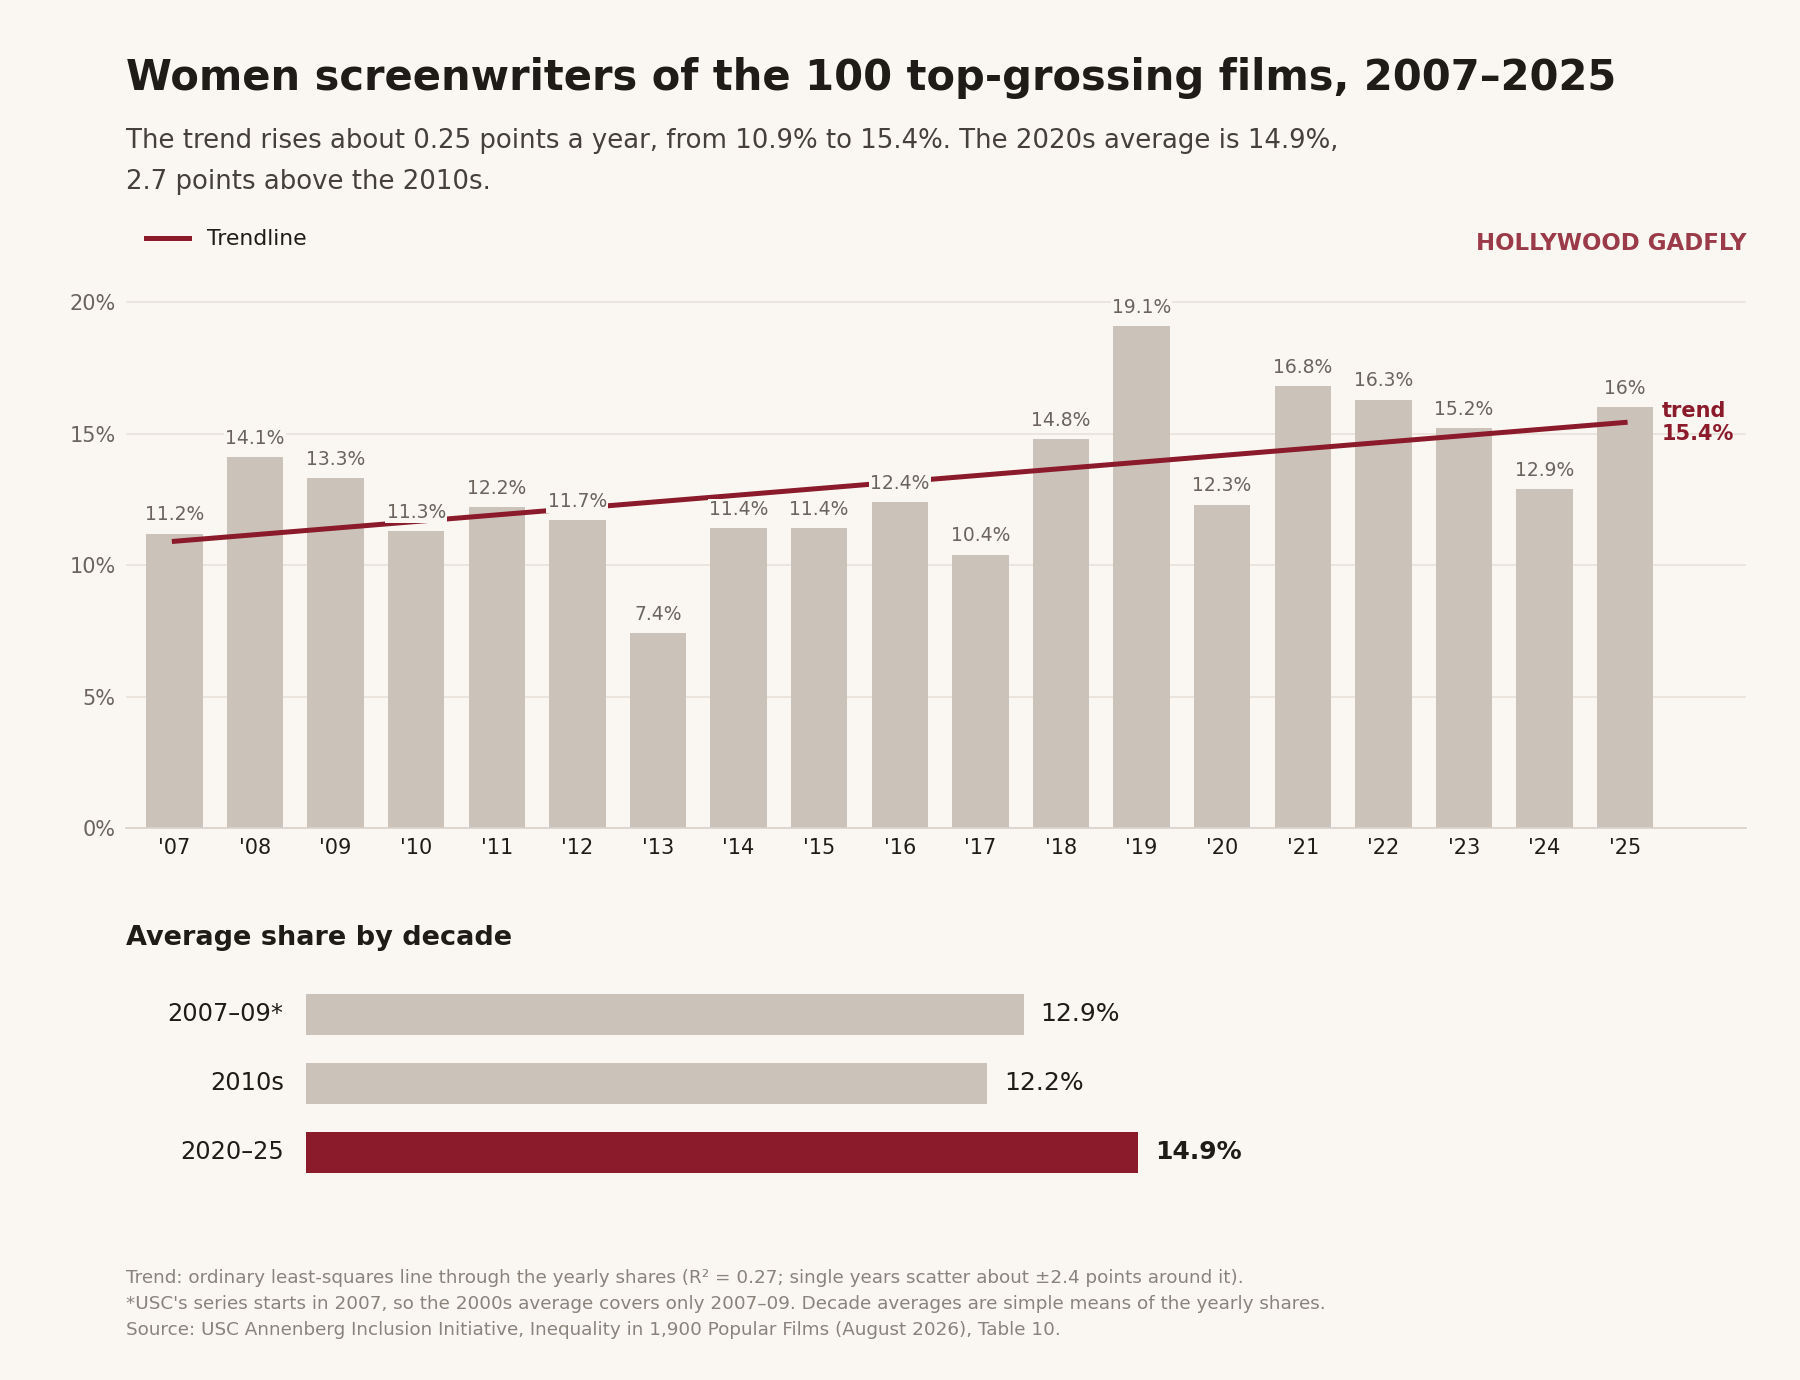
While there is a small improvement, this is honestly not great.
Like the top 100 directors, the pool of top 100 writers is very small and incumbent-driven.
So, as we did with the agencies, let’s look one level below the top 100 feature writers, at the pool that feeds them.
According to the WGA’s 2025 inclusion report, women are now 45% of TV writers, nearly parity, and 33% of feature writers, more than double their top 100 share.
BIPOC people are 43% of the population and 40% of TV writers. Also near parity.7
Since we’re comparing eras, let’s look at the actual numbers from ten years ago. There was no WGA inclusion report then, but Dr. Darnell Hunt created an equivalent for the WGA West, which I combined with the 2016 WGA Hollywood writers’ report:
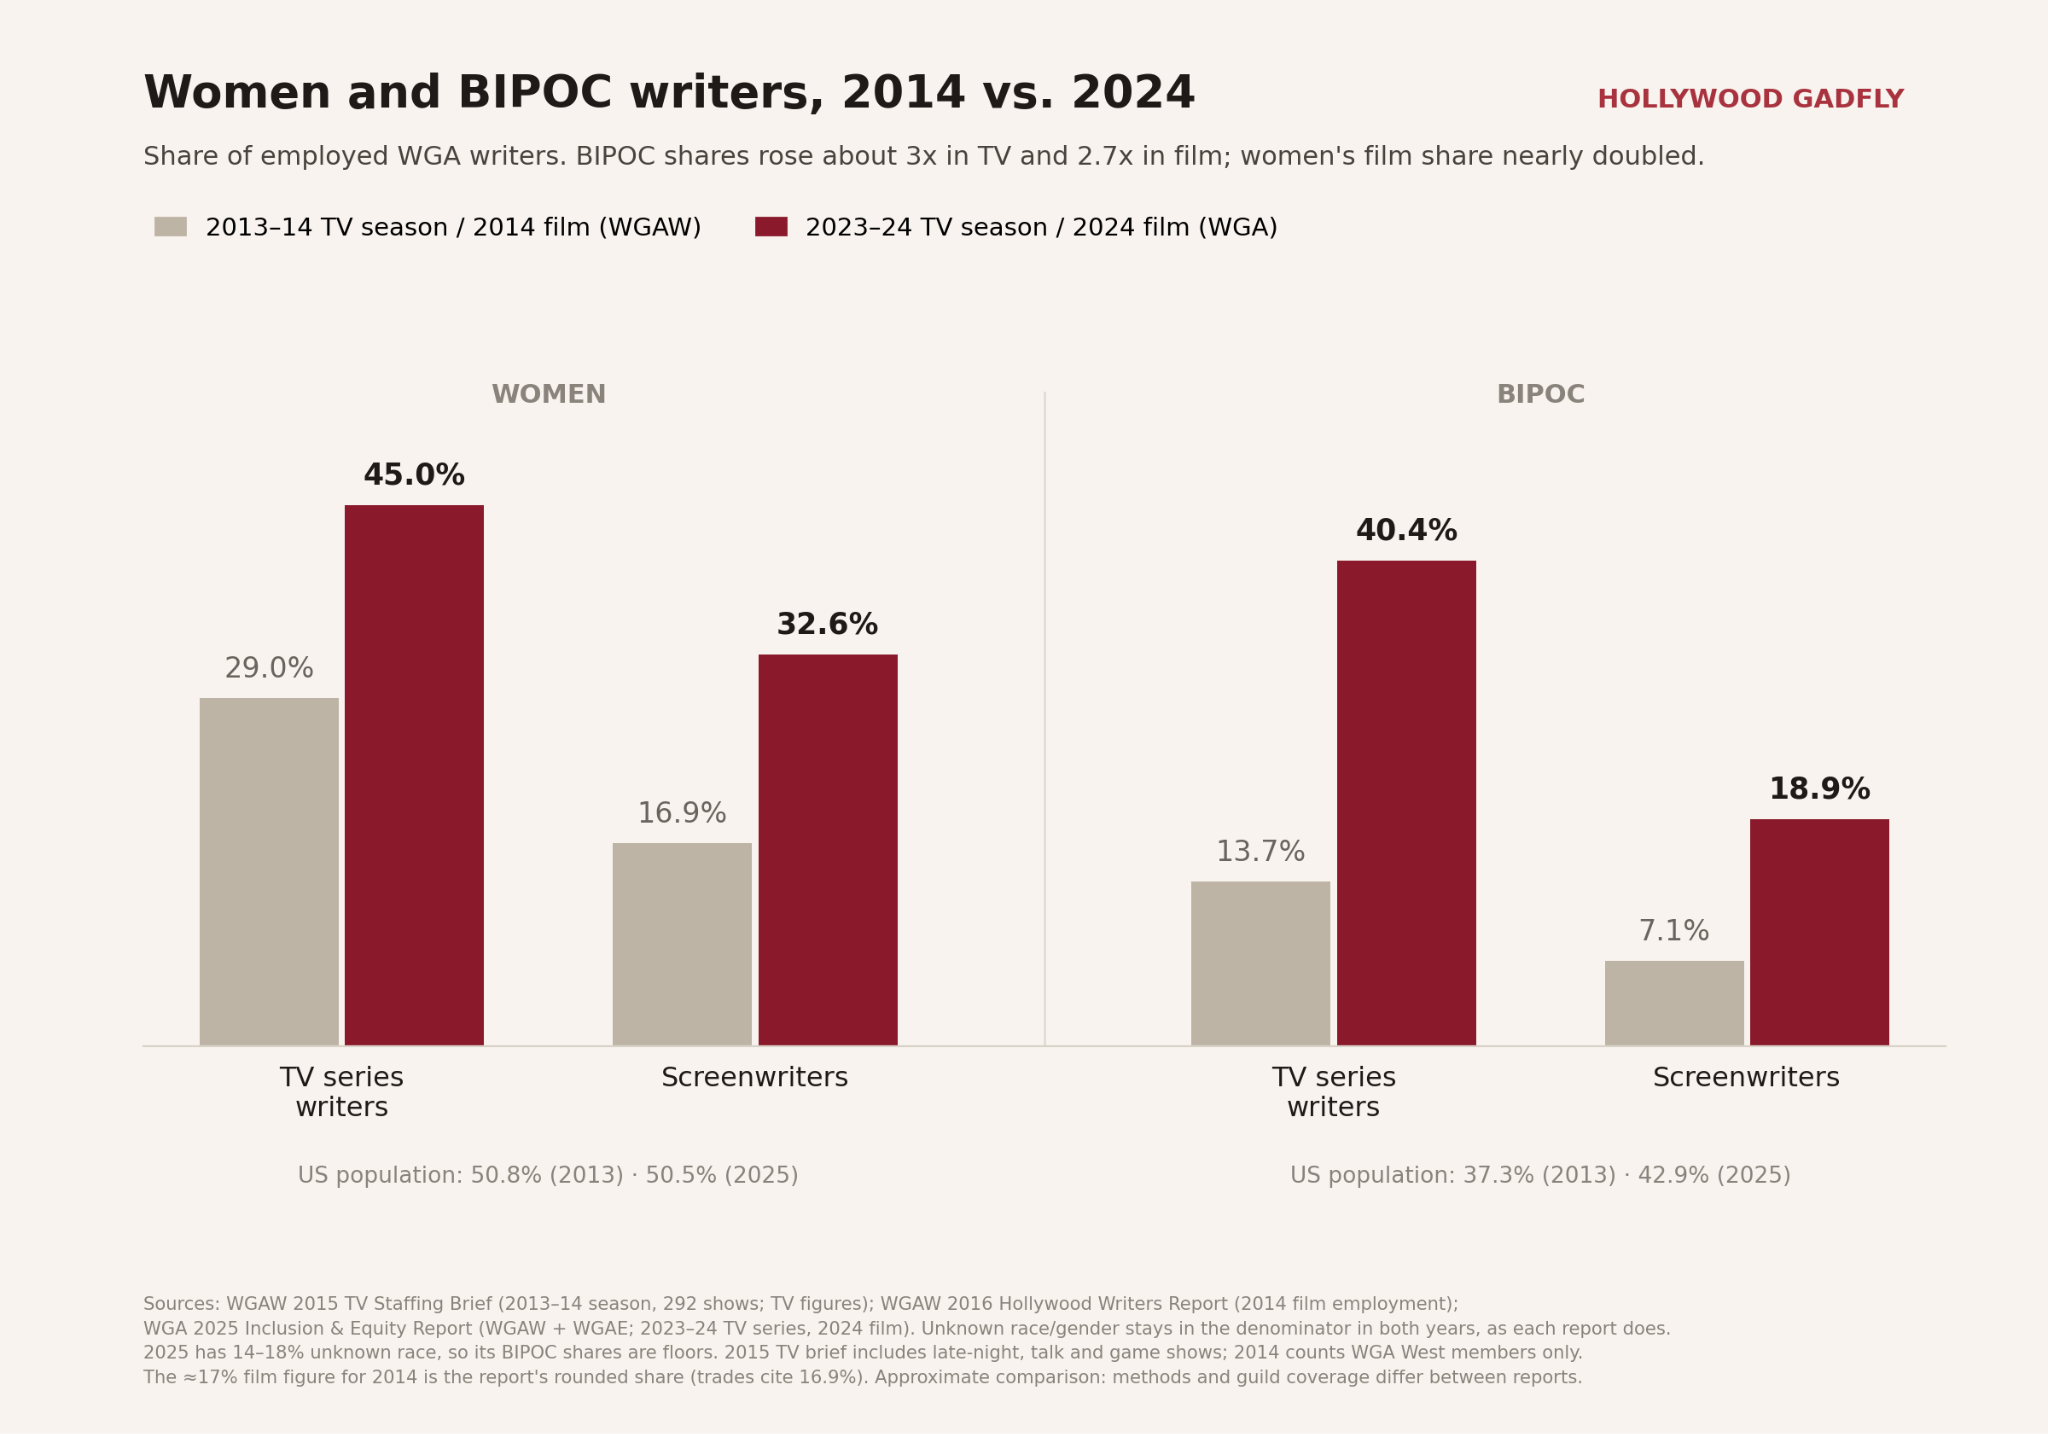
Here we find massive progress. Women’s share of TV writing jobs rose by more than half, and nearly doubled in film. BIPOC writers’ share nearly tripled in TV and grew more than two and a half times in film.
Showrunners
David cites a UCLA finding from the 2013–14 TV season: among broadcast show creators repped by the top 3 agencies, minorities were underrepresented by a factor of more than 15 to one.8
Pretty bleak. But, as you probably guessed, there was significant progress here as well.
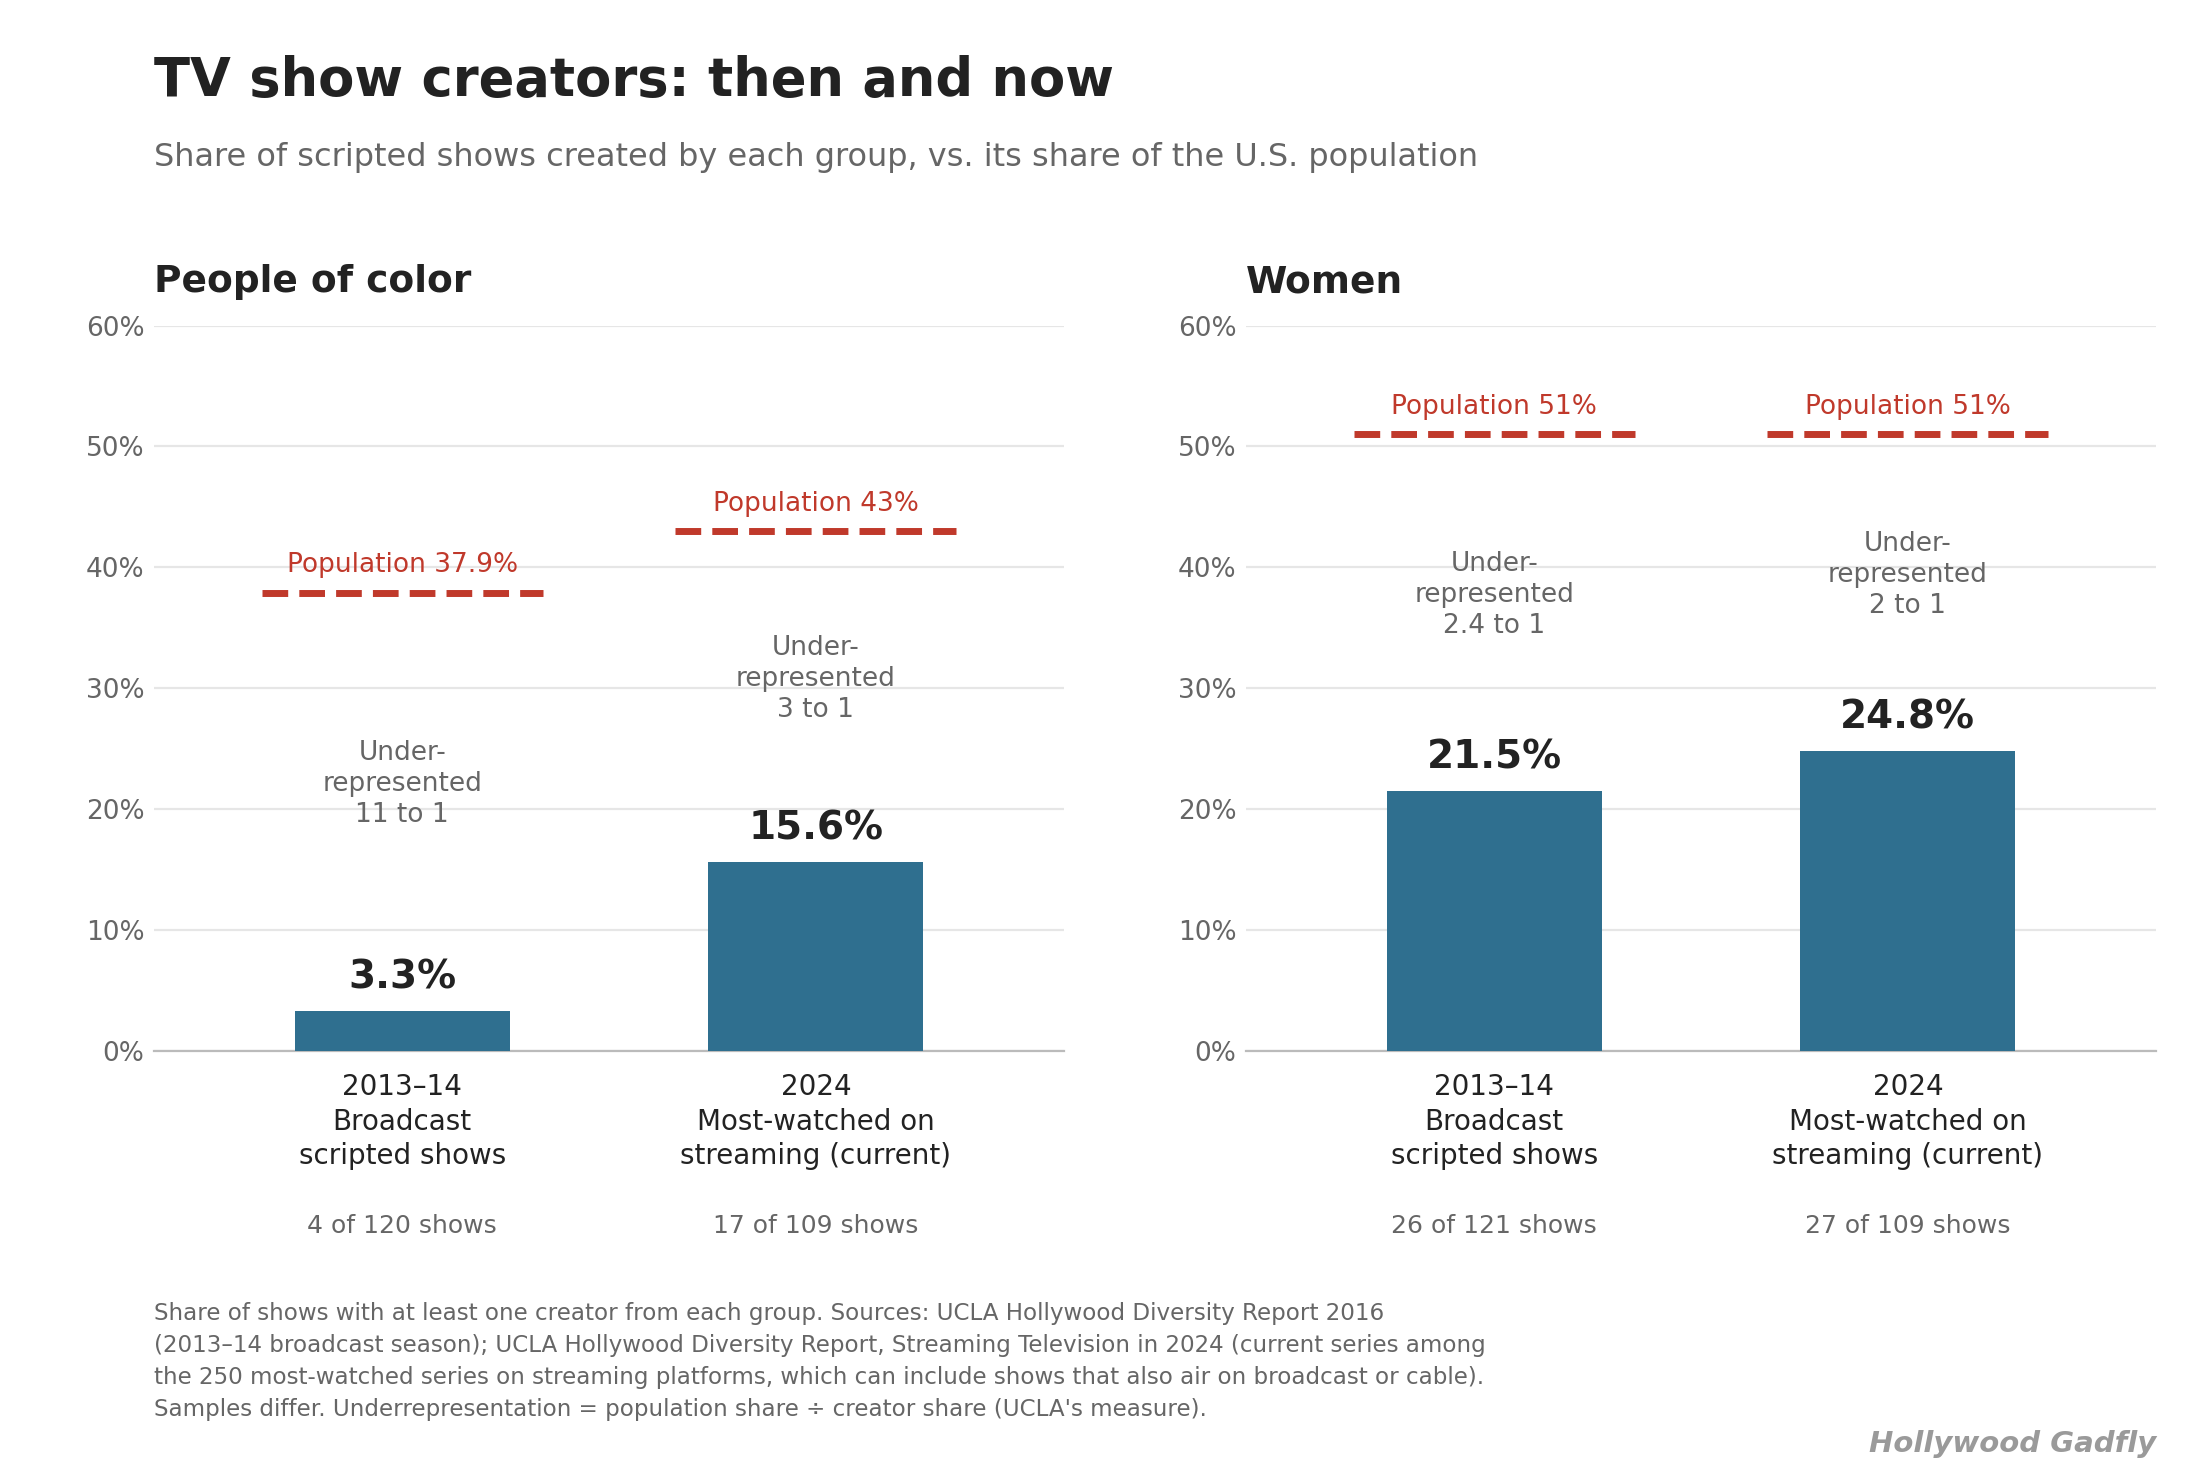
The share of shows created by people of color more than quadrupled from 2014 to 2024.
Women’s share of show creators barely moved, from 21.5% to 24.8%. But they also started from a much higher base: in 2013–14, women already created more than six times as many broadcast shows as people of color did.
Part 3: The Kane Parsons Problem
David writes in her piece that Kane Parsons was chosen for Backrooms because he was “a kid who reminded the producers of themselves at that age.”
In his A24 interview with James Wan, Parsons describes going viral at 15 with a series of Attack on Titan animations he made in Blender:

In January of 2022, less than a year later, he started publishing the Backrooms shorts. The first short went viral, and he started getting emails from people in the industry. By the end of 2022, the short had over 43 million views on YouTube.
Parsons already had a track record, the most important thing in our business, before he even published the Backrooms videos.
This is why people were reaching out to him, because he had created an extremely viral property in a highly lucrative genre. At 16!
The producers themselves have said in interviews that they didn’t even know how old Parsons was until they had their first meeting, when he brought his dad onto the Zoom call.
A track record of extremely viral shorts in a highly lucrative genre feels like a far more plausible explanation for his success than affinity bias. And the film did go on to gross $400m dollars.
So Where Are We Heading?
Across agencies, writers and directors, the same pattern shows up: a middle tier that has diversified dramatically in ten years, feeding a top tier built on track records from a less equal era.
Agents become partners. TV writers become showrunners. The women directing top-100 films since 2022 are only now making and releasing their next projects. And that older male incumbent population will eventually age out: Ridley Scott is 88. Steven Spielberg is 79. James Cameron is 72.
At the agency level, affinity bias may well be real, but the middle tier is majority female now, and the progress their client lists bring is very slow.
The partners at the top three agencies are now 68% male, and inching downward.
The available evidence doesn’t establish how much of the remaining gap comes from bias versus other factors, including incumbency and attrition: partners are drawn from agents who may have started 20 years ago and, in some cases, founded the agencies themselves.
Through the efforts of a generation, the industry’s middle has rapidly shifted. The top is moving too, some parts more quickly than others.
But as you’ve seen, it’s all moving in the right direction.
And that gives me hope.
In honor of my first cross post, I’m offering 25% off all annual subscriptions for HFF readers, ending Sunday at midnight! Sign up here!
Here is a summary version of the dataset, with counts but no names, to protect people’s privacy:
Footnotes:
1: These numbers focus only on TV and film lit, talent, unscripted TV, media rights, media finance, production arts, independent film and book agents, the latter because they option so much future movie and TV material. Ambiguous gender names (Alex, etc.) were hand-coded.
2: I did not have the time or resources to hand code every individual agent by race, which has a lot of methodological issues (if someone is half Latino, half white, do they count as both? Half? Are Jewish people white? Armenians? Different studies, like USC and UCLA, classify Madeline Sharafian, codirector of Elio, for example, an Armenian American director, differently.) UCLA does not share its coding data, so it’s impossible to know who got coded as what race, or to reproduce it properly. They say only that researchers used Variety Insight and other media sources. I found almost no race information on Variety Insight, so I can only infer they hand coded. Here is their exact footnote:
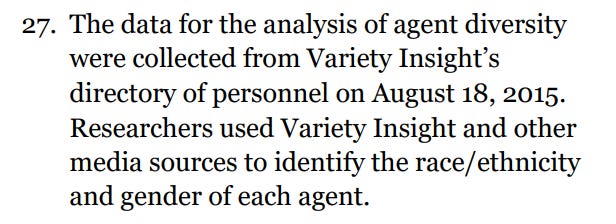
3: For the gender count, I pulled data on the top 3 agencies on IMDbPro, then cross referenced it against the Luminate Film & TV database. For agents who appeared on only one list, I checked whether they still worked at the agency. UCLA’s only methods note (endnote 27) says its agent data came from Variety Insight’s directory of personnel, collected on August 18, 2015, with race and gender identified using Variety Insight and other media sources. It doesn’t say who counted as an agent or a partner, or which departments were included. Variety Insight has since become Luminate Film & TV, one of my two sources.
Because UCLA’s rules for each tier aren’t published, I compare the share of men in each tier rather than headcounts. My count finds 206 partners to UCLA’s 121, so our partner definitions almost certainly differ; most of my partners are at WME and UTA, which give the title more widely than CAA. Partners in corporate roles (finance, legal, communications, strategy) aren’t counted, since UCLA counted those as executive staff.
4: My current count is just 3.4 percentage points lower than UCLA’s 2015 figure. Given the different partner definitions, and the number of mergers in recent years, I’d treat that comparison as directional rather than a precise measure of change.
5: Method note. Client lists come from Luminate Film & TV (pulled Oct. 1, 2026), covering credited film, TV and streaming clients at CAA, WME and UTA. Client gender is Luminate’s recorded gender field; clients with no recorded gender are left out. Agent gender is my own coding from first names and public profiles, not self-reported. Agents’ client lists in Luminate are incomplete, so the figures describe who is listed, not every client an agent represents. Averages by agent cover agents with at least five clients of recorded gender. “Lit” and “talent” agents are classified from the word “Literary” or “Talent” in their titles. Only agents with a Luminate page are included in the client analysis. The ‘about 38% shorter’ figure comes from a regression of list length on agent gender, controlling for tier (agent or partner), agency and agent type.
6: Who’s counted, 2026: Most powerful content exec — Dana Walden (Disney), Donna Langley (NBCUniversal), Bela Bajaria (Netflix). Film studio chiefs — Donna Langley (Universal), Pam Abdy (Warner Bros., co-chair), Dana Goldberg (Paramount, co-chair), Courtenay Valenti (Amazon MGM). TV chiefs — Debra O’Connell (Disney), Pearlena Igbokwe (NBCUniversal), Channing Dungey (Warner Bros. TV), Cindy Holland (Paramount), Dana Goldberg (Paramount), Katherine Pope (Sony). Langley and Goldberg each hold two of the counted seats, so each appears twice across tiers.
Who’s counted, 2015: Most powerful content exec — none. Film studio chiefs — Donna Langley (Universal), Stacey Snider (Fox, co-chair). TV chiefs — Dana Walden (Fox Television Group, co-chair), Amy Powell (Paramount Television), Cyma Zarghami (Viacom kids and family networks).
Companies: 2015 — Disney, NBCUniversal, Time Warner, Viacom/Paramount, Sony, Fox, Lionsgate, Netflix, Amazon. 2026 — Disney, NBCUniversal, Warner Bros. Discovery, Paramount, Sony, Amazon MGM, Apple, Lionsgate, Netflix. Co-chairs count as separate seats; some executives appear in more than one tier. 2026 TV counts Katherine Pope at Sony; counting Sony TV chairman Keith Le Goy instead gives 38% (5 of 13). 2026 Warner Bros. names are pre-merger, since the Paramount Skydance acquisition hadn’t closed at time of writing.
The Annenberg row (bottom of chart): not a hand count, and the two studies aren’t a repeated instrument, so treat the trend as directional. 2016 figure: Comprehensive Annenberg Report on Diversity (CARD), data as of February 1, 2016 — SVP-and-above executives at the film divisions of 10 major media companies, n=1,558 executives across film/TV/streaming combined; film-only total 33.1% (top executives — Chair/CEO/President — 25.6%; EVP-equivalent 29%; SVP-equivalent 40.4%). 2025 figure: Annenberg’s separate global film-executive study (May 2025) — SVP-and-above at U.S. film companies, distributors and subsidiaries, 42.9% (U.S.-only figure; the study also covered the U.K. and France).
Sources: company announcements and trade reporting (Deadline, Variety, The Hollywood Reporter); USC Annenberg Inclusion Initiative and Media, Diversity & Social Change Initiative.
7: There are large disparities within the BIPOC subgroups, with Black creatives the most overrepresented and Latino creatives being the most underrepresented.
8: That’s just two creators out of 84. Counting every broadcast scripted show that season, not just those whose creators were repped by the top three agencies, it was 4 of 120, or underrepresentation of about 11 to one. That’s the baseline I use.
Ted’s note: Because this TakeOver engages directly with Raquelle David’s earlier Hope for Film article and with research from the USC Annenberg Inclusion Initiative, I gave both David and USC Annenberg an opportunity to review the piece before publication and to identify factual, methodological, or interpretive concerns.
Both David and USC Annenberg reviewed the piece and declined to provide a public response.
My goal in publishing both TakeOvers is not to declare a winner in a debate. It is to help all of us get a more accurate picture of where our industry actually stands, what has changed, what hasn’t, and what the available evidence can—and cannot—tell us. Let’s move the conversation forward!